
Operating Stories: The $20 Billion Swing - How Uber turned losses into a cash machine.
Operating Stories. The Dara Khosrowshahi era, 2017 through Q1 2026.

A personal note before the trilogy
This is the first article in a three-part Operating Stories arc on Uber. Article two looks at Uber as a multi-product logistics and commerce operator. Article three looks at the autonomy strategy as a textbook application of aggregation theory. I am publishing them as a deliberate arc (an Operating Stories tryptych) because the story of Uber under Dara Khosrowshahi is the most under-read operating turnaround of the last decade, and it rewards reading in order.
If you want the fast version of the whole trilogy in one paragraph, here it is.
Between 2017 and 2026, a single CEO and a disciplined team executed three turnarounds in series inside one company. A cost turnaround. A platform turnaround. A capital turnaround. Every one of them is stealable by an operator running a ten-person company or a ten-thousand-person company. This first piece is about the first one.
New to Operating by John Brewton?
Three reader favorites to start with:
A $20 billion swing that nobody credits to operating discipline
In 2019, Uber reported a $5.2 billion GAAP net loss on $14.1 billion in revenue.
In 2025, Uber reported $10.0 billion in free cash flow on $52.0 billion in revenue. Adjusted EBITDA reached $8.7 billion. Adjusted EBITDA margin on gross bookings reached 4.5 percent, up from 4.1 percent the prior year. Gross bookings for the full year crossed $193 billion. The company was in the S&P 500, which it had joined in December 2023, and returned roughly half of its free cash flow to shareholders through buybacks during that two-year window.
The swing from a $5.2 billion loss to $10 billion in cash generation over six calendar years represents roughly $15 billion in annual P&L improvement, within a company that was already producing more revenue than the 85th-largest country by GDP. Against 2017, when Dara Khosrowshahi took over an Uber bleeding $4.5 billion in operating losses, the cumulative swing between the 2017-2019 loss window and the 2023-2025 profit window is closer to $21 billion.
Twenty-one billion dollars is roughly the combined market capitalization of Hertz, Etsy, and Yelp. It is three times the price Verizon paid for AOL, about twice what Microsoft paid for LinkedIn, and more than the entire market value of the United States Postal Service’s implicit government guarantee. It is not a rounding error. It is the largest nominal P&L swing ever achieved by a consumer technology company within a single CEO's tenure.
The stock market’s response over the same window is the second surprise. The IPO priced in May 2019 at $45 per share and closed its first trading day at $41.90, down seven percent. By March 2020, in the depths of COVID, the stock had fallen to $13.71. The 2026 trading range sits above $67. The gain from IPO is around 50 percent. The gain from the COVID low is over 400%. Over the same window, the Nasdaq Composite roughly doubled. Uber, the company Wall Street spent most of 2019 and 2020 describing as structurally unprofitable, compounded at a pace that the word structurally was never designed to accommodate.
That is the opening.
The tension the article will work with is as follows: The conventional explanation for the turnaround is that Uber grew its way into profit. The financial record shows that the turnaround happened before the growth reacceleration, not because of it, and that growth was the consequence of the turnaround, not the cause.
The thesis
The Khosrowshahi-era Uber turnaround was not a growth story that finally achieved scale. It was a capital-allocation turnaround executed under the cover of a growth narrative. Uber did not grow its way to profit. It divested, deconsolidated, refused, and re-priced its way to profit. Then it grew.
The financial spine
I want to walk through the financial evidence carefully because the headlines have buried what actually happened.
Start with the pre-Khosrowshahi baseline. In 2017 Uber reported a $4.5 billion GAAP operating loss and a roughly $4.5 billion net loss on approximately $7.0 billion in revenue.
The company was carrying eight figures of monthly burn, a pending Waymo lawsuit, an internal cultural crisis, and a board fight that ended with the departure of the founding CEO. Dara Khosrowshahi took the job in August 2017.
His first full year in the seat, 2018, produced $11.3 billion of revenue and a $1.8 billion GAAP net loss. Operating loss was still above $3 billion.
The headline most often written about 2018 was that Uber’s losses were narrowing. That was true, and it was also beside the point.
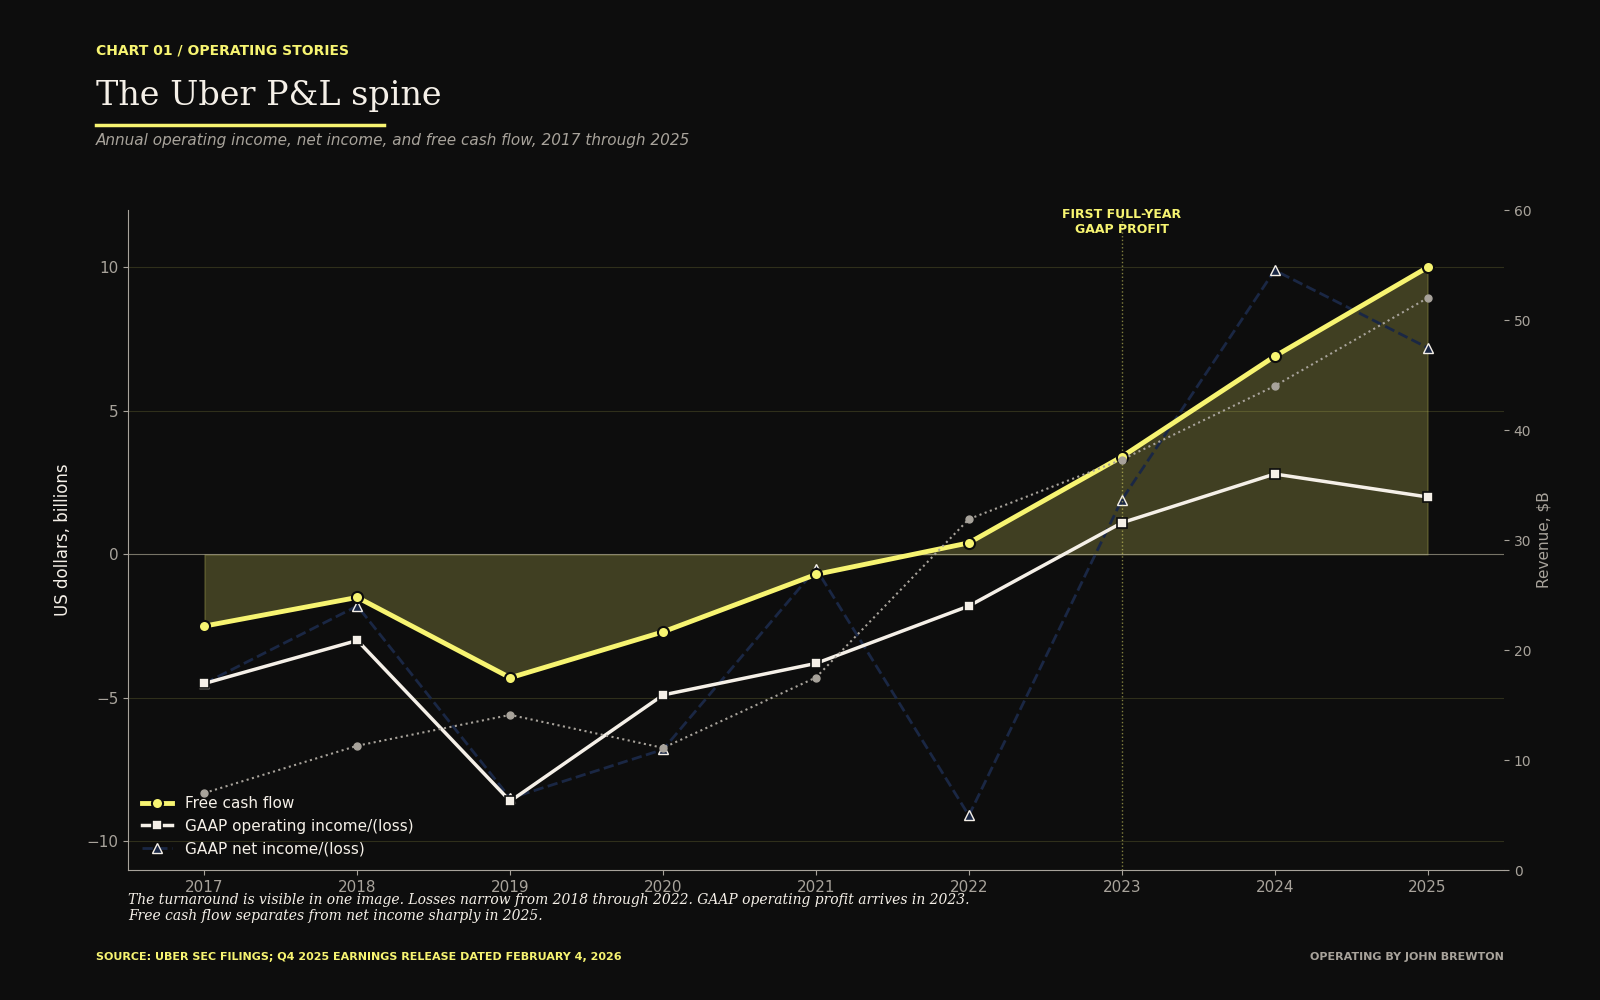
The turnaround is visible in one image. Losses narrow from 2018 through 2022. GAAP operating profit arrives in 2023. Free cash flow separates from net income sharply in 2025.
The IPO arrived in May 2019. The filing priced at $45 per share, valuing the company at approximately $82 billion on a fully diluted basis. Day one closed at $41.90. The stock spent most of its first twelve months as a public company below $35. Inside the 2019 filings, Uber took a $5.2 billion GAAP net loss, of which a significant portion was stock-based compensation that Khosrowshahi described on the earnings call as a once-in-a-lifetime charge. The description was financially accurate. It was also a marker. The company had chosen to front-load the most painful accounting into the earliest post-IPO quarter. A management team planning to compound over a decade does not spread the pain. They take it.
Between 2020 and 2022 the company pushed through two things in parallel. The first was a set of divestitures that removed unprofitable or non-core businesses from the balance sheet. The second was a cost-structure overhaul that cut headcount by roughly 6,700 people in 2020 alone, trimmed variable driver incentives back toward sustainable unit economics, and flattened organizational hierarchy inside the core business. By the end of 2022, gross bookings had more than doubled from the 2020 trough, operating losses were inside one billion dollars, and adjusted EBITDA had crossed zero.
2023 is the inflection. First full-year GAAP operating profit: $1.8 billion. First full-year GAAP net income: $1.8 billion. First inclusion in the S&P 500, announced in December. Free cash flow of $1.1 billion. Revenue of $31.9 billion, up 17 percent year over year.
2024 consolidated the win. Revenue of $44.0 billion. Adjusted EBITDA of $1.8 billion at the annual level, expanding to a $2.5 billion quarterly run rate by Q4. GAAP net income of $4.4 billion, boosted in part by a deferred tax asset release but durable on an underlying basis. Free cash flow of $1.7 billion. Monthly active platform consumers crossed 170 million. Trips per monthly active user reached an all-time high in Q2 2024 and kept climbing.
2025 compounded it. Revenue of $52.02 billion, up 21 percent year over year. Adjusted EBITDA of $8.7 billion, up 35 percent year over year. Adjusted EBITDA margin on gross bookings of 4.5 percent. Gross bookings of $193 billion, up 20 percent. Free cash flow of $10.0 billion, up 42 percent year over year, and crossing 90 percent of adjusted EBITDA conversion. Mobility take rate held in the 27 to 30 percent range across quarters. Advertising crossed a $1.5 billion run rate at 60 percent year-over-year growth. Uber One membership passed 30 million subscribers.
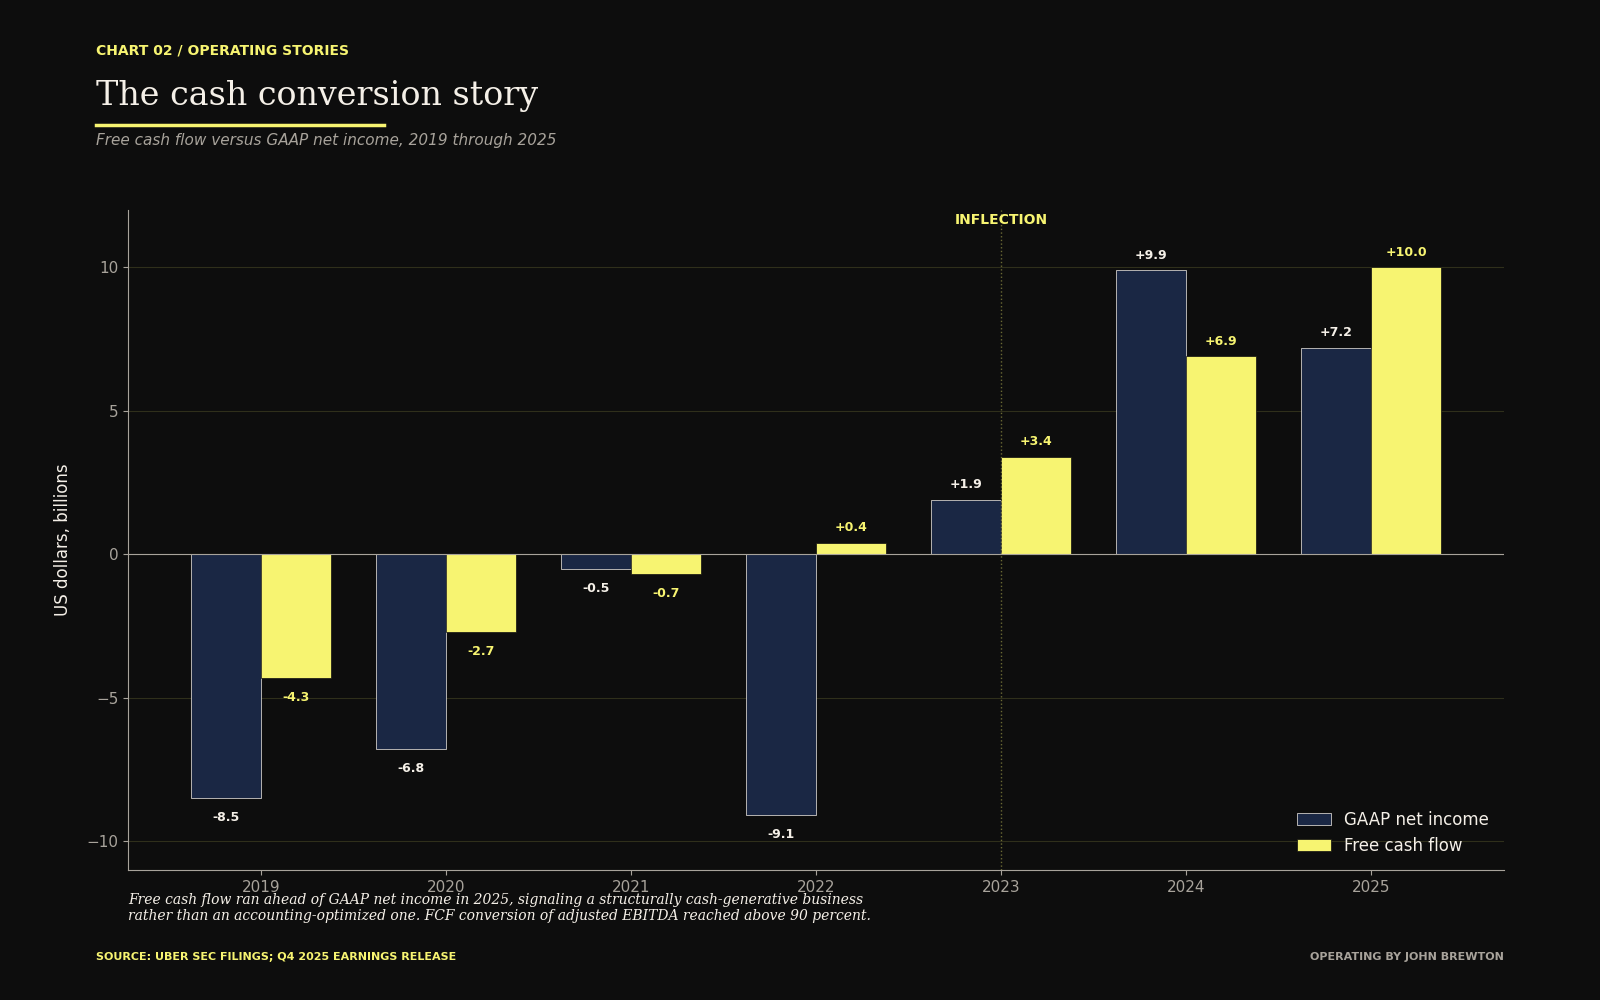
Cash conversion is the real story. Free cash flow ran ahead of GAAP net income in 2025, signaling that the business is now structurally cash-generative rather than accounting-optimized.
Guidance for Q1 2026, filed alongside the Q4 2025 release in early February 2026, called for $52.0 to $53.5 billion in gross bookings, up 17 to 21 percent in constant currency, and adjusted EBITDA of $2.37 to $2.47 billion. Non-GAAP earnings per share at the midpoint implied 37 percent year-over-year growth. The Q1 2026 earnings call is scheduled for May 6, 2026. I will update the series with live Q1 numbers when they print.
Now I want to stop and pull one specific number out of the spine. Compare 2019 to 2024. Revenue grew from $14.1 billion to $44.0 billion, a factor of roughly 3.1. Headcount grew from approximately 22,000 to approximately 30,800, a factor of roughly 1.4. Revenue per employee grew from roughly $640,000 to roughly $1.43 million, a factor of 2.2. The 80 percent growth in gross bookings against a 10 percent growth in employees that Khosrowshahi cited on the 2024 investor day was not a favorable ratio. It was a structural re-engineering. The company built a cost curve that separates from its revenue curve, and operating leverage now drops through the whole P&L.
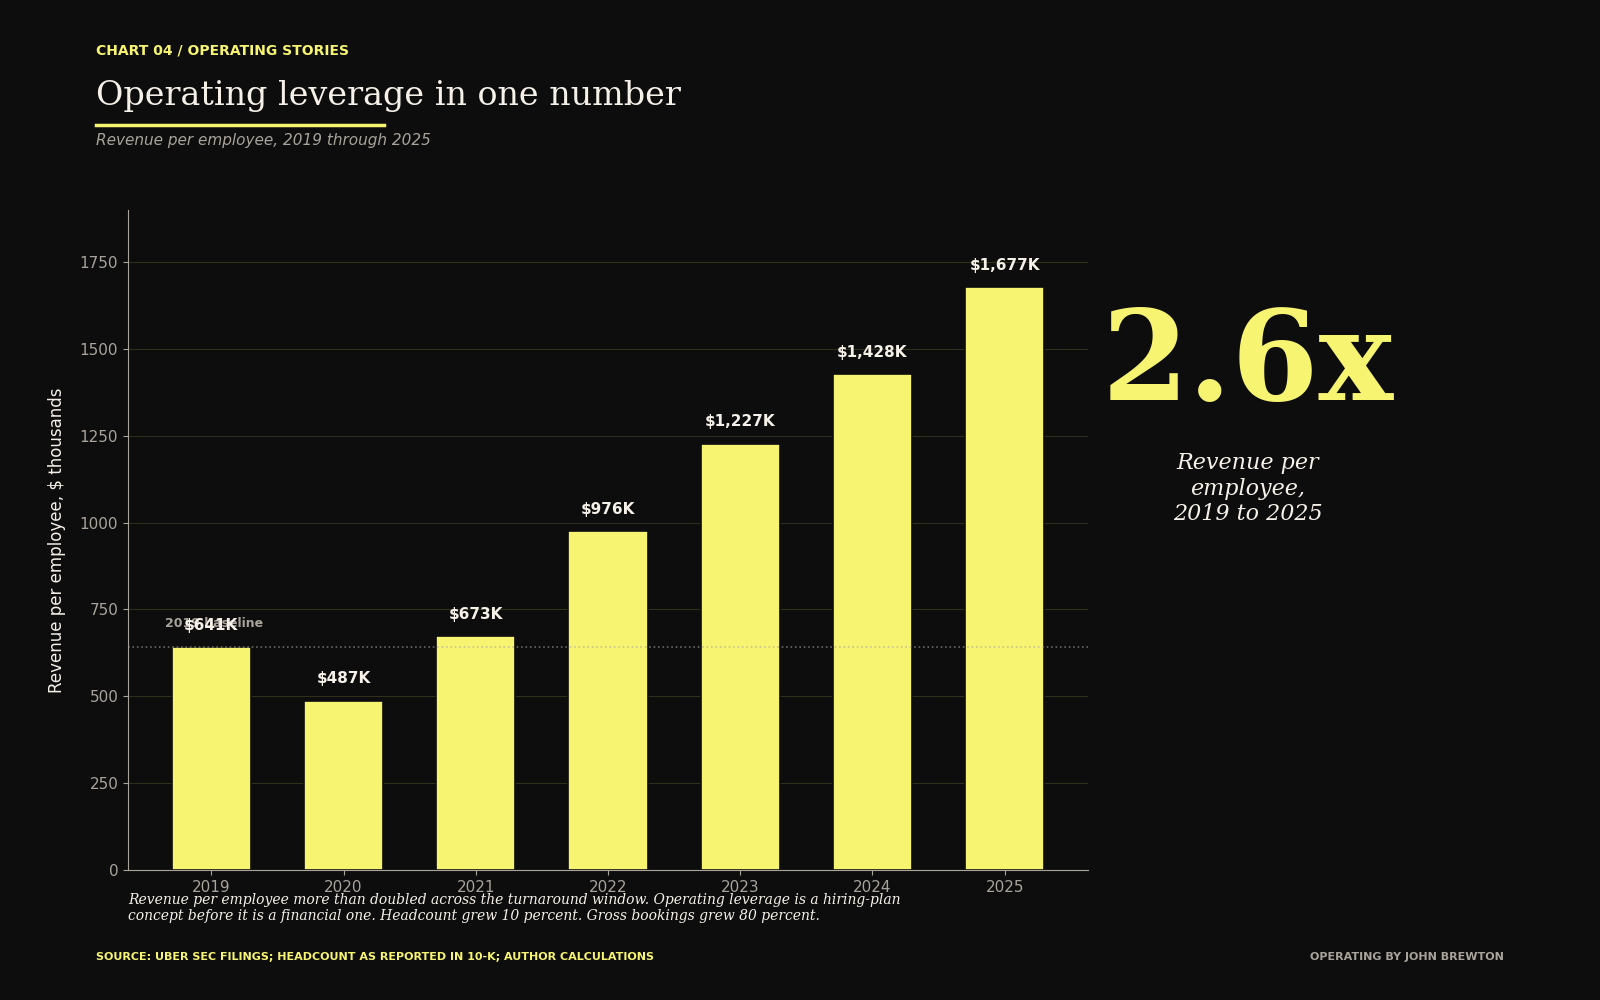
Revenue per employee more than doubled under the turnaround. Operating leverage is a hiring-plan concept before it is a financial one.
That is the spine. The losses narrowed, then they stopped, then they reversed, and now the cash conversion is widening faster than revenue is growing. The interesting question is how.
The mechanism: a capital-allocation turnaround hiding inside a growth story
The conventional explanation for Uber’s profitability is that the business finally scaled, so unit economics finally turned positive. That explanation is not wrong. It is incomplete. It misses the three things that actually produced the turnaround.
One. The divestiture program.
Between 2016 and 2022, Uber systematically removed businesses from its balance sheet that either could not be won or could not be made profitable under its cost of capital. Russia went to Yandex. Southeast Asia went to Grab. China went to Didi. Uber Eats India went to Zomato. Uber Advanced Technologies Group, the in-house autonomous vehicle effort, went to Aurora in December 2020 for equity and a board seat. Drizly, acquired in 2021 for $1.1 billion, was shut down in 2024 after the integration failed to deliver. Cornershop’s minority partners were consolidated and absorbed into the Uber Eats grocery surface rather than run as a separate brand.
The gross cash generated from those divestitures through Q1 2026 is estimated between $8 billion and $12 billion. Net of the losses taken on publicly traded stakes (Grab, Zomato, Aurora), the realized balance sheet gain was smaller, on the order of $2 billion to $3 billion. The cash mattered less than the removal. Every divested business had been consuming management attention, regulatory bandwidth, and capital that was now available for redeployment into mobility, delivery, advertising, and membership.
Most public-company CEOs do not sell. Selling is unglamorous. It triggers impairment charges. It is read by the press as retreat. The Khosrowshahi-era Uber sold aggressively from a position of weakness between 2018 and 2021, and then it kept selling from a position of strength between 2022 and 2024. Treat divestiture as a product. Operators who want to emulate the turnaround should start here.
Two. The unit-economic rebuild.
Uber rebuilt driver economics before it touched consumer pricing. This is backwards from most consumer companies. Most consumer companies cut product quality or raise prices on consumers first. Uber did the harder thing, which was to reconstruct the match between rider, driver, and platform incentive, and then push pricing through once the match was structurally sound.
The work happened inside the 2019 to 2022 window. Driver incentive variable spend was rationalized away from the aggressive match rates that had been used in 2016 and 2017 to build supply during the land-grab years. Surge pricing was re-tuned to reduce variance on the driver side while preserving the spike-day revenue capture on the consumer side. Mobility take rate moved from a mid-20s range compressed by incentive spend to a stable 27 to 29 percent range. In Q4 2025 mobility take rate reached 29.9 percent.
On the delivery side the path was different. Delivery take rate declined from roughly 20 percent in 2022 to an estimated 18 to 19 percent through 2025, as DoorDash competitive intensity forced operators to keep restaurant and merchant economics attractive. Uber did not fight that compression. It stacked a higher-margin revenue layer (advertising) and a higher-attach revenue layer (membership) on top, so that delivery could run at slightly thinner transaction margins while delivering rising profit per active user.
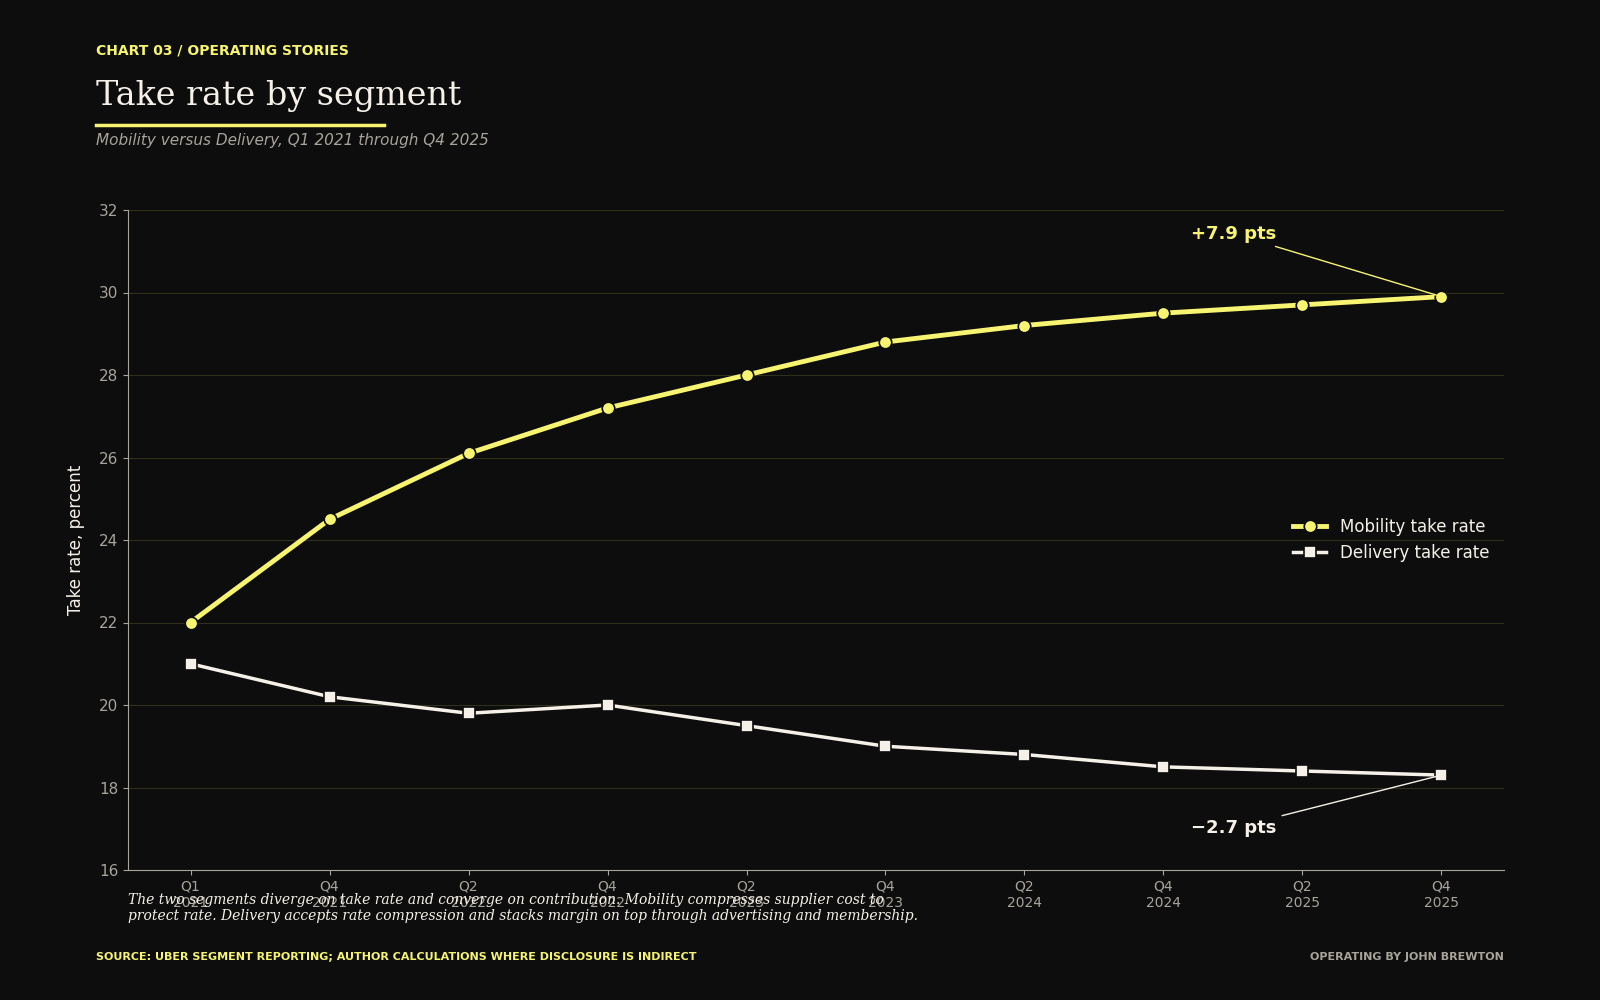
The two segments diverge on take rate and converge on contribution. Mobility compresses supply cost to protect rate. Delivery accepts rate compression and stacks margin on top through advertising and membership.
Three. The capital-return commitment.
At the February 2024 investor day, the company committed to returning roughly 50 percent of free cash flow to shareholders through buybacks and, in time, dividends. That commitment was made while free cash flow was still $1.7 billion, which made the commitment non-trivial. The 2025 number of $10 billion in free cash flow vindicated the commitment. The first year of buybacks took place under that policy and retired meaningful share count. Net share count now trends down over time rather than up.
The discipline matters more than the absolute number. Returning capital forces a company to treat free cash flow as a resource that has a cost. It breaks the internal habit of treating cash as a rainy-day buffer that management can spend on acquisitions of declining strategic relevance. Uber committed to the discipline before the result. That ordering is what separates an operating company from a treasury.
Historical Operating Parallels
The mechanics above map cleanly onto three of the most studied corporate turnarounds of the last thirty years. I want to walk through each one because the mapping is where the playbook becomes transferable.
Parallel one: Lou Gerstner at IBM, 1993-2002.
In April 1993 Lou Gerstner took over an IBM that had lost $8.1 billion the prior year on $64.5 billion of revenue. The analyst consensus, and it was a loud consensus, was that IBM had to be broken up into independent business units, each of which would have a chance to compete in its own market. Gerstner declined. He believed that IBM’s durable advantage was the ability to deliver integrated solutions to enterprise customers, and that breaking up the company would forfeit exactly the thing that made the whole worth more than the sum of its parts.
Gerstner’s operating playbook across the next nine years included three moves that are directly relevant to Uber. The first was decisive cost action. IBM reduced headcount by roughly 100,000 people between 1993 and 1994. The second was divestiture of non-core businesses. IBM sold the Federal Systems Company to Loral in 1994 for approximately $1.5 billion and walked away from a semiconductor strategy that was consuming capital without producing strategic return. The third, and the most important, was the construction of a higher-margin business (IBM Global Services) on top of the lower-margin legacy business (hardware).
The financial result. IBM’s net income moved from a $8.1 billion loss in 1992 to a $4.2 billion profit by 1994, a swing of $12.3 billion inside two years. Services became the majority revenue contributor by the end of the decade. The stock compounded at approximately 14 percent annually from Gerstner’s arrival through his departure in 2002, against an S&P 500 that returned approximately 11 percent over the same window.
The mapping to Uber is precise. Khosrowshahi, like Gerstner, declined the breakup narrative. Activists and analysts during 2019 and 2020 argued that Uber should be split into mobility and delivery, with mobility returned to shareholders as a cash cow and delivery sold or spun off. Khosrowshahi refused. He argued, correctly, that the two businesses shared a customer acquisition funnel and that over one third of Uber Eats first-time users arrived through the mobility app. The cost action mirrors Gerstner’s. The 6,700 layoffs in 2020 were the Uber equivalent of Gerstner’s 100,000 cuts. The divestiture program (Russia, Southeast Asia, China, ATG, Eats India) is directly analogous to Gerstner’s non-core asset sales. And the construction of the advertising and membership businesses on top of mobility and delivery is the direct structural analog of Global Services on top of IBM hardware.
Operators should take from the Gerstner comparison one specific principle. A legitimate operating turnaround does not require breaking up the company. It often requires refusing to. The integrated platform is frequently the source of the turnaround, not the obstacle to it.
The full Operating Stories deep dive continues below.
Paid subscribers get the remaining two historical parallels (Satya Nadella at Microsoft, Howard Schultz at Starbucks), the four operating principles extracted as a directive playbook, the broader implications section, the conclusion, and
The AI Prompt Pack with sixteen prompts that walk you through applying the playbook to your own business inside a working session with Claude, ChatGPT, Gemini or Perplexity,
The Operating Playbook Worksheet
The 22-page Deep Dive Financial and Historical Report.
Subscribe to continue reading →
