This Not 1929 or 2008: Why This Time Really Is Different
An Operator’s Take on Unnecessary Hysteria
New to Operating by John Brewton?
Check out these reader favorites:
Part 1 of the Operator’s Investment Thinking Series
Most advice about markets comes from traders, portfolio managers, and Wall Street analysts, people whose success depends on beating benchmarks and timing quarterly rotations. But operators face a fundamentally different challenge: we’re not just allocating capital to assets on a screen, but building businesses with real infrastructure, real employees, and real consequences that extend beyond the next earnings call. We manage P&Ls, make technology investments, navigate economic cycles, and steward personal wealth built over years of operational execution. Yet almost no one writes about capital allocation through this dual lens, how the same frameworks that guide billion-dollar portfolio decisions should inform your warehouse automation spend, your AI tool adoption, or your personal hedging strategy.
This is why I’m launching Operator’s Investment Thinking as a new pillar of Operating by John Brewton. Drawing on fifteen years of navigating market cycles as both a business builder and investoron, my experience scaling companies, and my academic economics training from Harvard and the University of Chicago, this series bridges the gap between Wall Street theory and operator reality.
We’ll examine major market dynamics (bubbles, recessions, sector rotations, technological disruptions) not through the lens of “What should traders do?” but “How should operators allocate capital across their businesses, portfolios, and risk management strategies?”
Welcome to investment thinking for people who build things.
The $5 Trillion Question
Until recently, the word “bubble” was reserved for economist panels and financial TV. In the fall of 2025, it’s the question every serious business leader, founder, and capital allocator can’t avoid:
Are we living through a historic speculative mania in artificial intelligence? And if so, could it crash the economy or your business the way past bubbles have done?
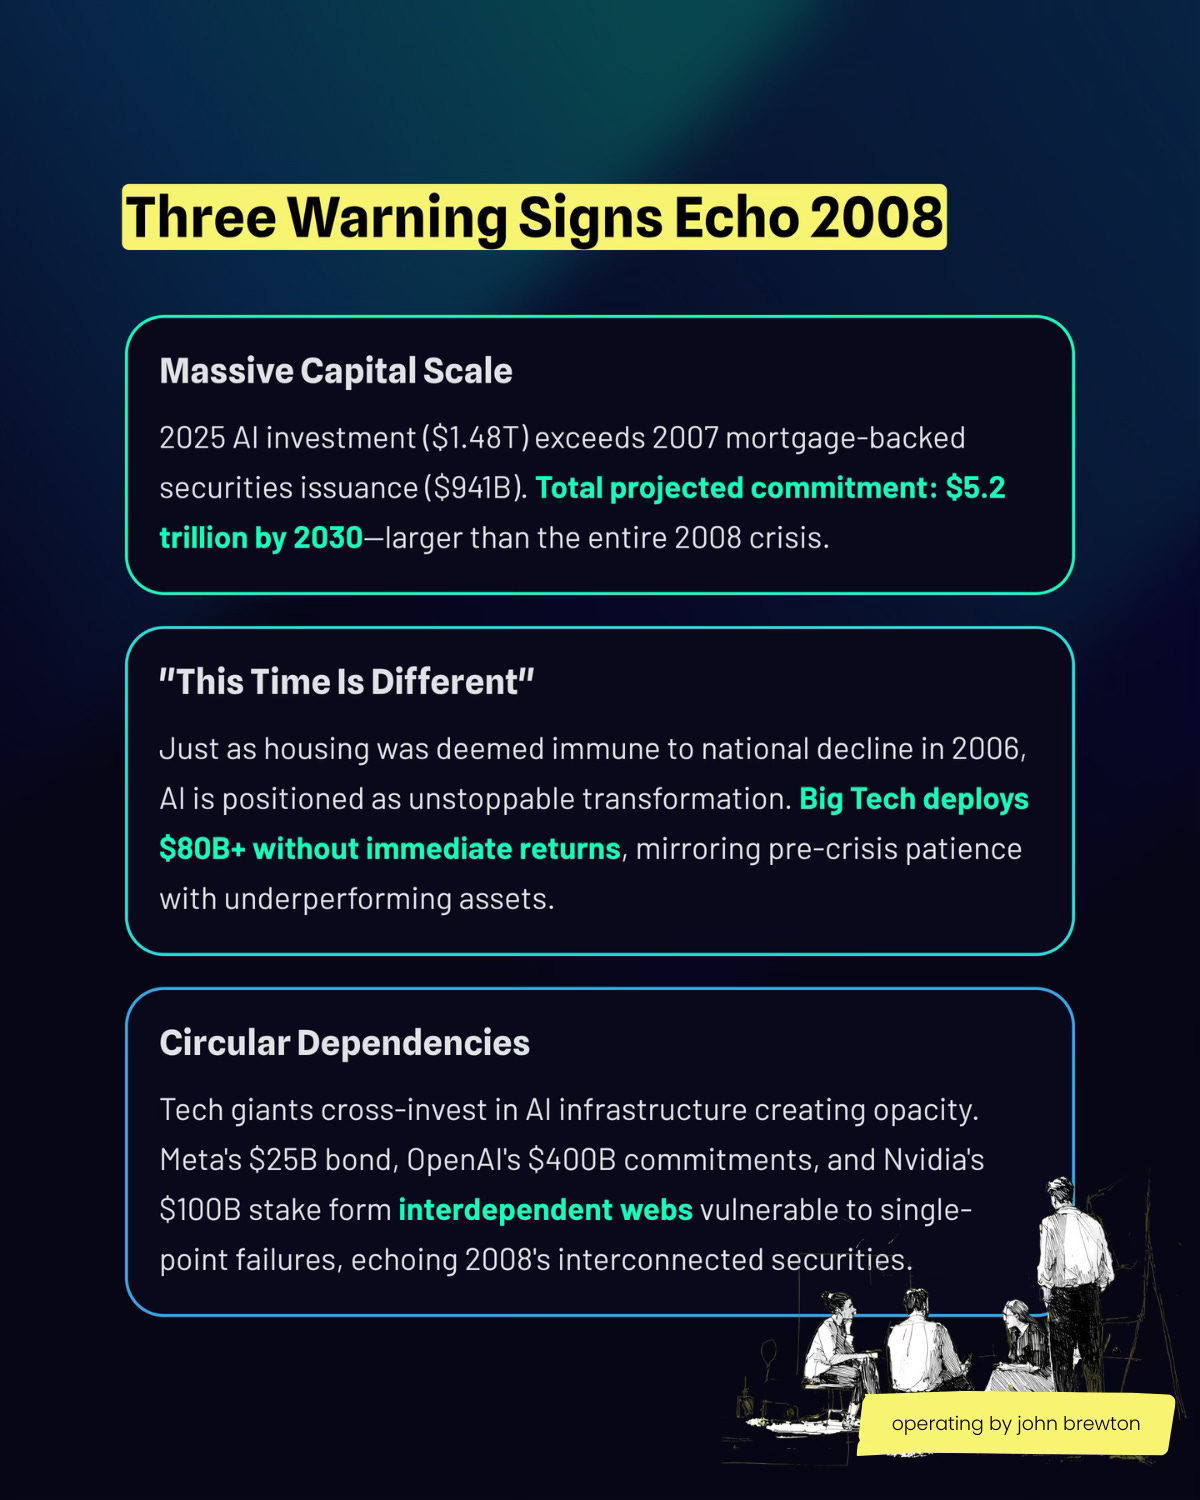
The data is staggering. The so-called Magnificent 7 stocks now make up nearly 38% of the S&P 500, the highest concentration ever recorded in modern financial history. By 2030, global investment in AI infrastructure will top $5.2 trillion (data centers, chips, power plants), dwarfing the scale of the dot-com buildout and rivaling capital upheavals that defined past economic eras.
If you read the headlines, or the warnings from central bankers, hedge funds and corporate leaders like Goldman Sachs CEO David Solomon (who sees “a market correction within the next year or two”), or claims that “this is seventeen times bigger than the dot-com bubble”, you’d be forgiven for feeling anxious, even paralyzed.
Is this 1929 all over again? 2008?
Do we risk not just a stock market rout but a fundamental rupture in employment, credit, even the basic functioning of our economy?
Those are important questions. But for operators, founders, and capital allocators, they’re not enough. The right question is not just “Is this a bubble?” but “Will it burst the way those bubbles did, and do I need to manage my business, my investments, and my risk as if the history books are about to repeat?”
As someone who scaled a supply chain business from $27 million to $75 million revenue through disciplined, debt-averse capital allocation, lived through both the 2008 financial crisis and the dot-com crash as a student, investor and operator, and has studied the history of financial crashes alongside some of the world’s leading economic historians and thinkers, I know how deeply these questions matter. As operators, we need a completely different lens to make sense of what’s happening now.
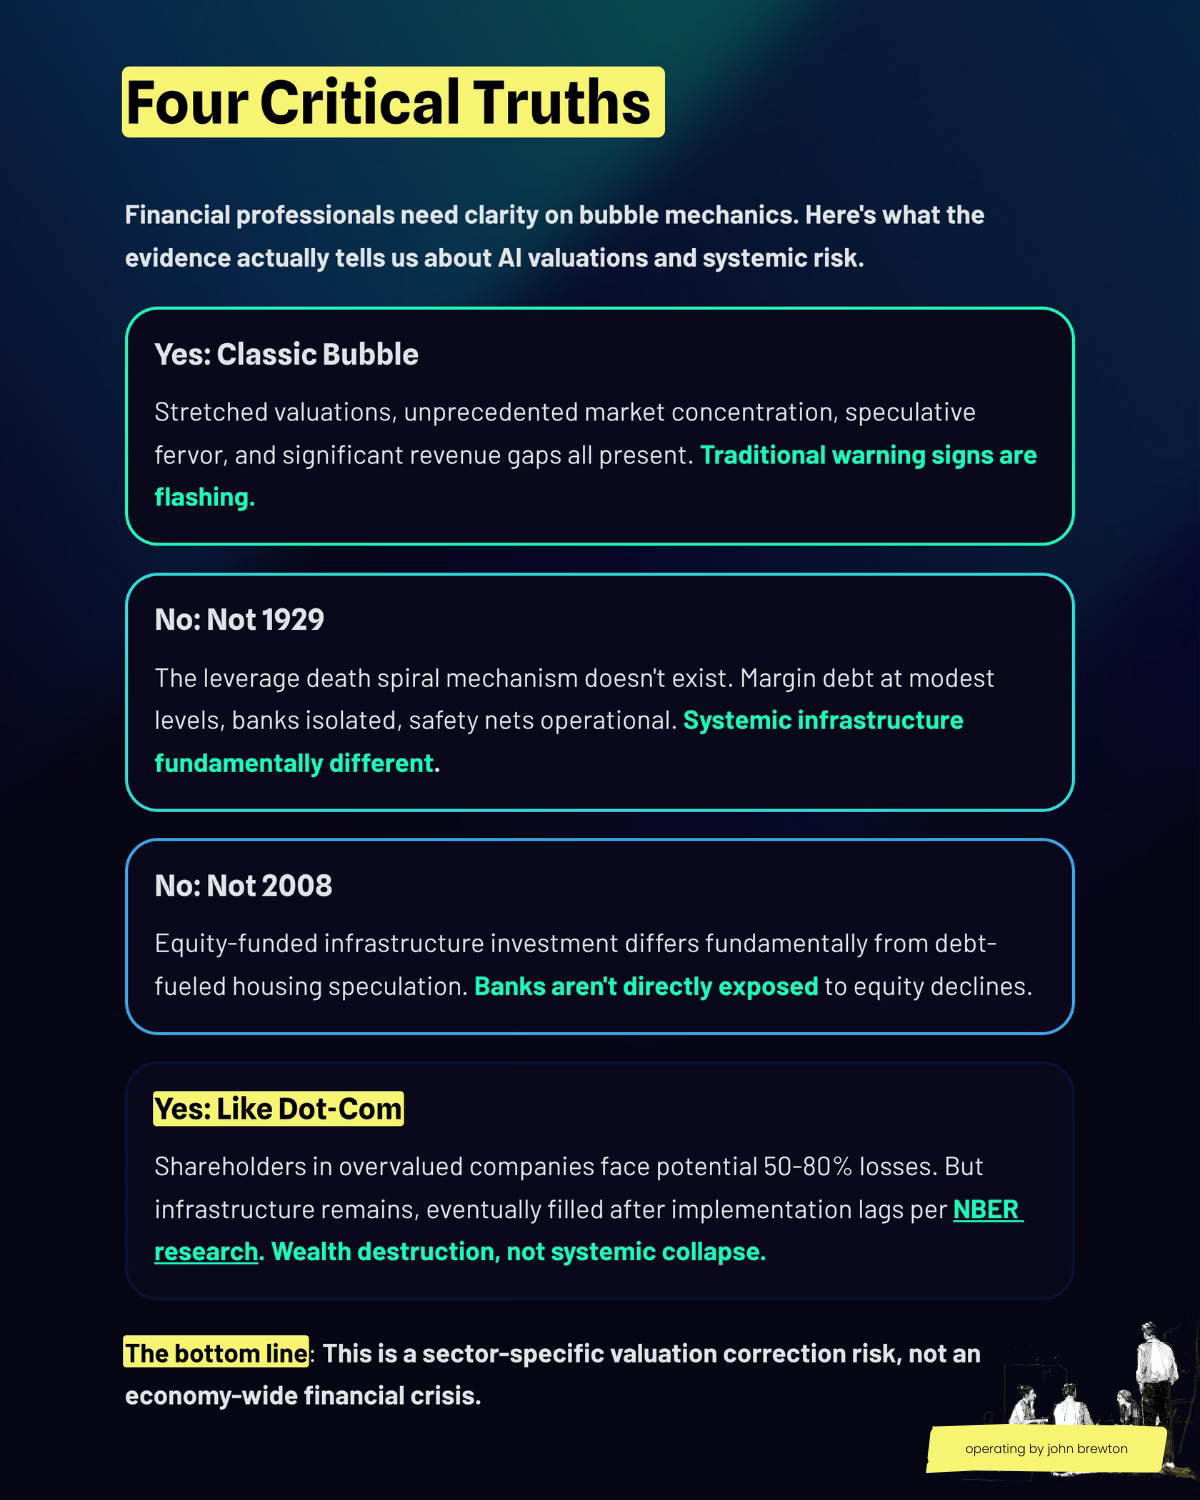
My thesis: Yes, today’s AI boom exhibits many classic bubble signs, from euphoric valuations to impossible growth narratives. But the structure, funding, and consequences of this bubble are fundamentally different than what drove 1929 and 2008. Understanding this distinction isn’t just an academic exercise—it’s the difference between panicking at headlines and confidently allocating capital to the right opportunities (and avoiding the landmines) as the cycle turns.
I. This Looks Like a Bubble
Let’s be honest: if it walks like a bubble and quacks like a bubble, it probably deserves serious scrutiny.
The Valuation Extremes
The Magnificent 7 (Apple, Microsoft, Nvidia, Amazon, Alphabet, Meta, and Tesla) now command a combined market capitalization exceeding $22 trillion. To put that in perspective: that’s larger than the entire GDP of China, and Nvidia alone represents approximately 8% of the entire S&P 500.
The tech sector’s dominance has reached levels not seen since the dot-com era. Bloomberg reports that “S&P 500 Tech Stock Dominance Reaches Dot-Com Bubble Level,” with the top six tech stocks now accounting for more than 30% of the index. Through October 2025, “gains for Nvidia, Microsoft and Meta alone account for about 270 points of the S&P 500’s 579-point advance in 2025.”
Forward price-to-earnings ratios tell a similar story. While Bloomberg notes that “tech giants have largely justified their elevated valuations with profit growth that outstrips share-price appreciation,” the Magnificent 7 trade at a forward P/E of 28.3x compared to the S&P 493’s 19.7x. That’s a 44% premium that assumes near-perfect execution.
The Concentration Risk
The 38% concentration in seven stocks is dangerous by any historical measure. During the 1929 bubble, utilities represented roughly 18% of NYSE market capitalization, and that concentration helped amplify the crash. We’re now at more than double that level.
The Wall Street Journal observed in late October: “Nvidia jumped nearly 5% and the Magnificent Seven by 1.3% on average...but [market breadth remains narrow], with many stocks still underwater for the year.” When concentration reaches these extremes, the index becomes a proxy for seven companies’ fate, not a diversified portfolio.
Even more alarming: Fortune reports that “AI spending added 0.5% to GDP growth” in the first half of 2025, meaning roughly one-third of U.S. economic growth came from data center construction. As one economist quipped, “Our economy might just be three AI data centers in a trench coat.”
The Spectacular Revenue Gap
Here’s where bubble warnings become impossible to dismiss. The Financial Times reports that “large tech companies are projected to invest $400bn on AI infrastructure this year,” with projections exceeding $350 billion in 2025 and climbing toward $500 billion in 2026.
Yet actual AI revenue generation remains comparatively tiny. Harvard Business School professor Andy Wu, in an October 29, 2025 interview, captured the problem perfectly:
“The problem is that generative AI today has a high variable cost and low variable revenue...A bubble is when everyone can see the value creation, but no one is thinking about the value capture.”
Wu draws a direct parallel to Pets.com, which created tremendous value (the entire pet e-commerce category) but captured none of it. The company went bankrupt in 2000, yet today Chewy.com, doing essentially what Pets.com envisioned, thrives. “Investors in Pets.com lost everything,” Wu notes. “But society gained the infrastructure and business model that eventually worked.”
This is the AI dilemma in microcosm. The Wall Street Journal reports that “tech companies are pouring hundreds of billions into data centers, taking on heavy debt, but current revenue is relatively tiny.” The investment-to-revenue ratio looks more like 100:1 or 166:1 than the sub-5:1 ratio seen in healthy, profitable businesses.
The Circular Financing Web
Perhaps most concerning are the complex cross-investments creating interdependencies reminiscent of pre-2008 financial engineering. Nvidia has invested $100 billion in OpenAI. OpenAI announced agreements to develop five new U.S. data centers, “pushing the cost of its AI infrastructure project Stargate to about $400bn”—against projected 2025 revenue of roughly $20 billion.
The Financial Times notes that “credit market hit with $200bn ‘flood’ of AI-related issuance” in 2025, with Meta alone readying a $25 billion bond sale to fund AI infrastructure. When companies invest in each other’s success at this scale, a single point of failure could have a cascading effect.
The Expert Chorus of Concern
The warnings aren’t just coming from perma-bears. Yale economists published statistical evidence of “speculative bubbles” in six of the seven Magnificent stocks (excluding Apple). JPMorgan CEO Jamie Dimon has warned of a 30% probability of a market correction within two years. The Bank of England explicitly stated that “the risk of a sharp market correction has increased.”
Bloomberg reported “Dot-Com Fears Rise With Tech Stocks Seeing $100 Billion Swings,” noting that single OpenAI partnership announcements were moving stock prices by more than the entire market cap of most S&P 500 companies.
Even Stanford GSB research on fear of missing out shows that “people tend to cluster around risky categories out of a desire to avoid missing ‘the next big thing’”, a dynamic clearly visible in retail investor rotation into speculative AI plays.
So yes: this looks like a bubble. The question is: what kind of bubble, and does it end in 1929-style apocalypse, 2008-style crisis, or something entirely different?
II. Historical Parallel #1
The 1929 Crash
To understand whether we’re headed for catastrophe, we need to examine what actually made 1929 so devastating and whether those conditions exist today.
What Happened Then: The Anatomy of Collapse
In September 1929, the U.S. stock market peaked at $89.7 billion in total value (NYSE only). By November, after Black Monday and Black Tuesday, it had fallen to roughly $30 billion, a loss of $34 billion in two days, or 38% of market value. By July 1932, the bottom, markets had lost $71-74 billion, roughly 70.5% of U.S. GDP at the time.
The Dow Jones Industrial Average tells the story starkly: 381.17 at the September peak, 230.07 after the initial crash, and a gut-wrenching 41.22 by July 1932, an 89.2% decline from peak to trough.
But the stock market crash was just the trigger. The real devastation came from what followed: bank failures, credit freezes, and economic collapse. Between 1930 and 1933, approximately 10,000 banks failed, 36% of all U.S. banks. As the New York Times detailed, “During the 1930s, approximately 9,000 banks failed...In 1929, it was margin, everyone became swept up in purchasing stocks with borrowed funds.”
GDP fell 30% from 1929 to 1933. Unemployment hit 25%. One-third of farmers lost their land. The money supply declined 30%, choking off credit to businesses and households. The economic destruction was total and systemic.
The Mechanism: Leverage as Accelerant
What turned a stock market correction into the Great Depression?
Leverage.
In 1929, margin requirements were just 10-15%, meaning investors could buy $100 worth of stock with only $10-15 in cash, borrowing the rest. The New York Times reports that margin debt reached $10 billion, a staggering 9.6% of U.S. GDP ($104.5 billion). More alarmingly, margin debt represented 10-20% of total NYSE market value.
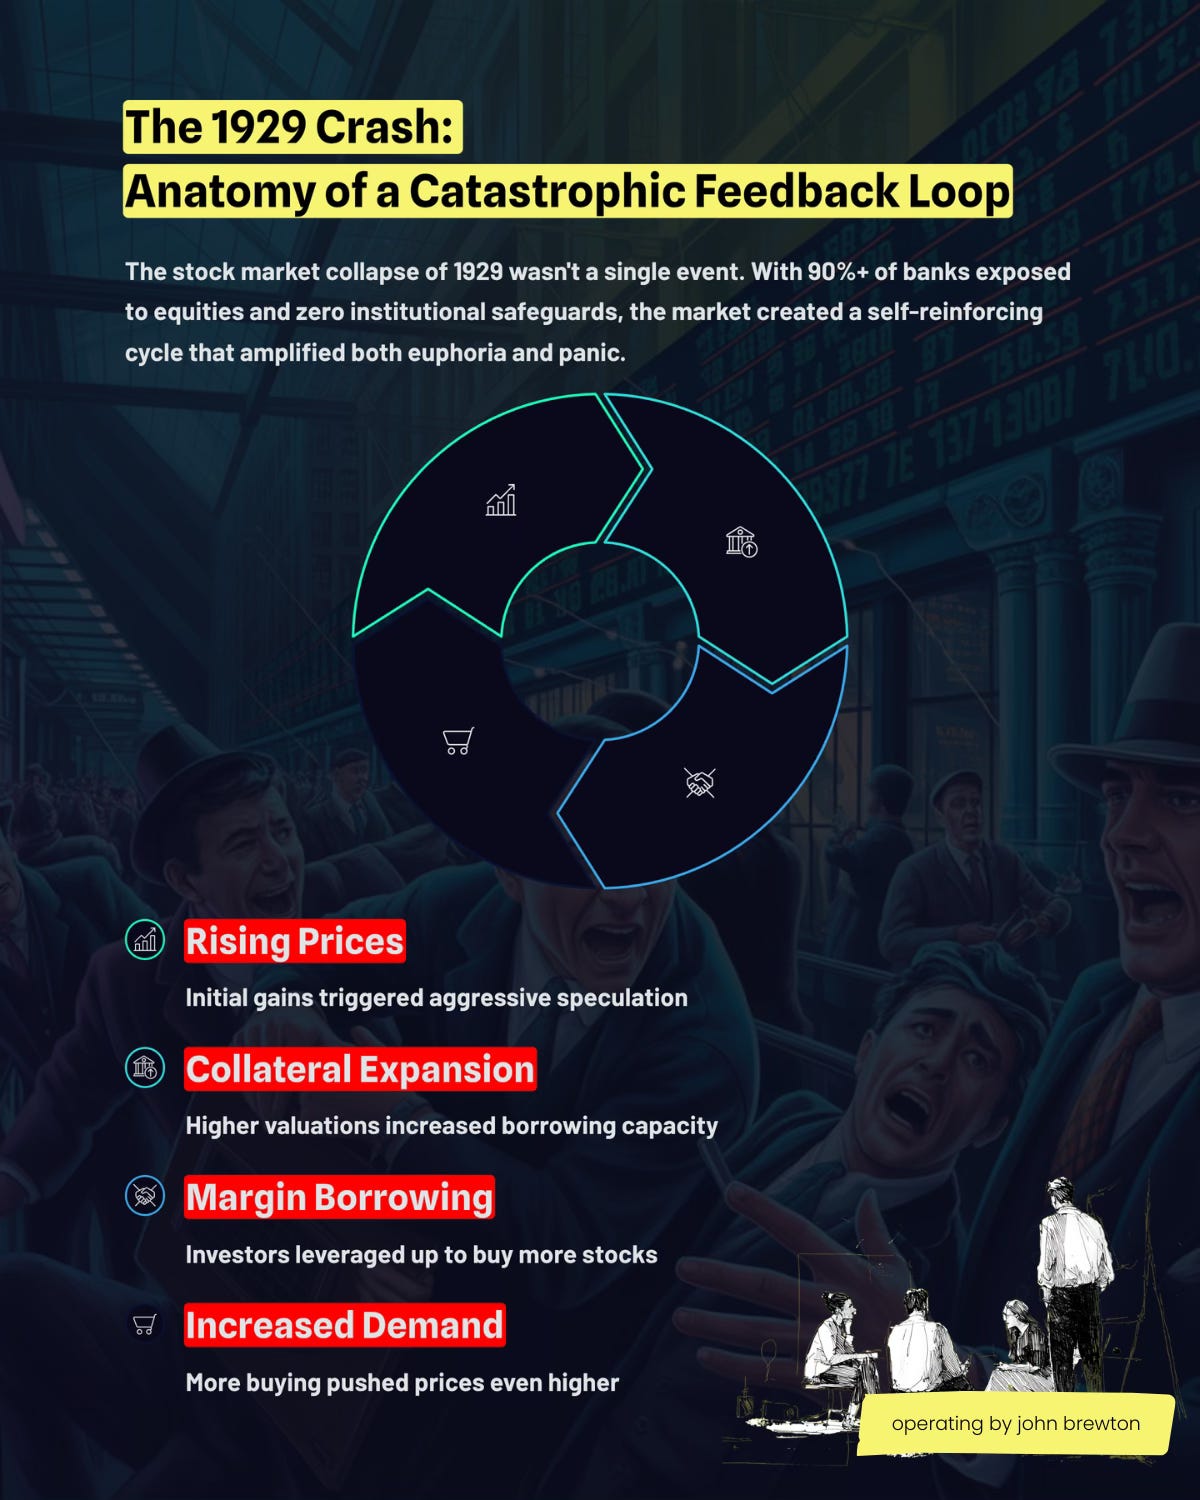
This created a catastrophic feedback loop:
Rising prices → more collateral → more borrowing → more buying → higher prices
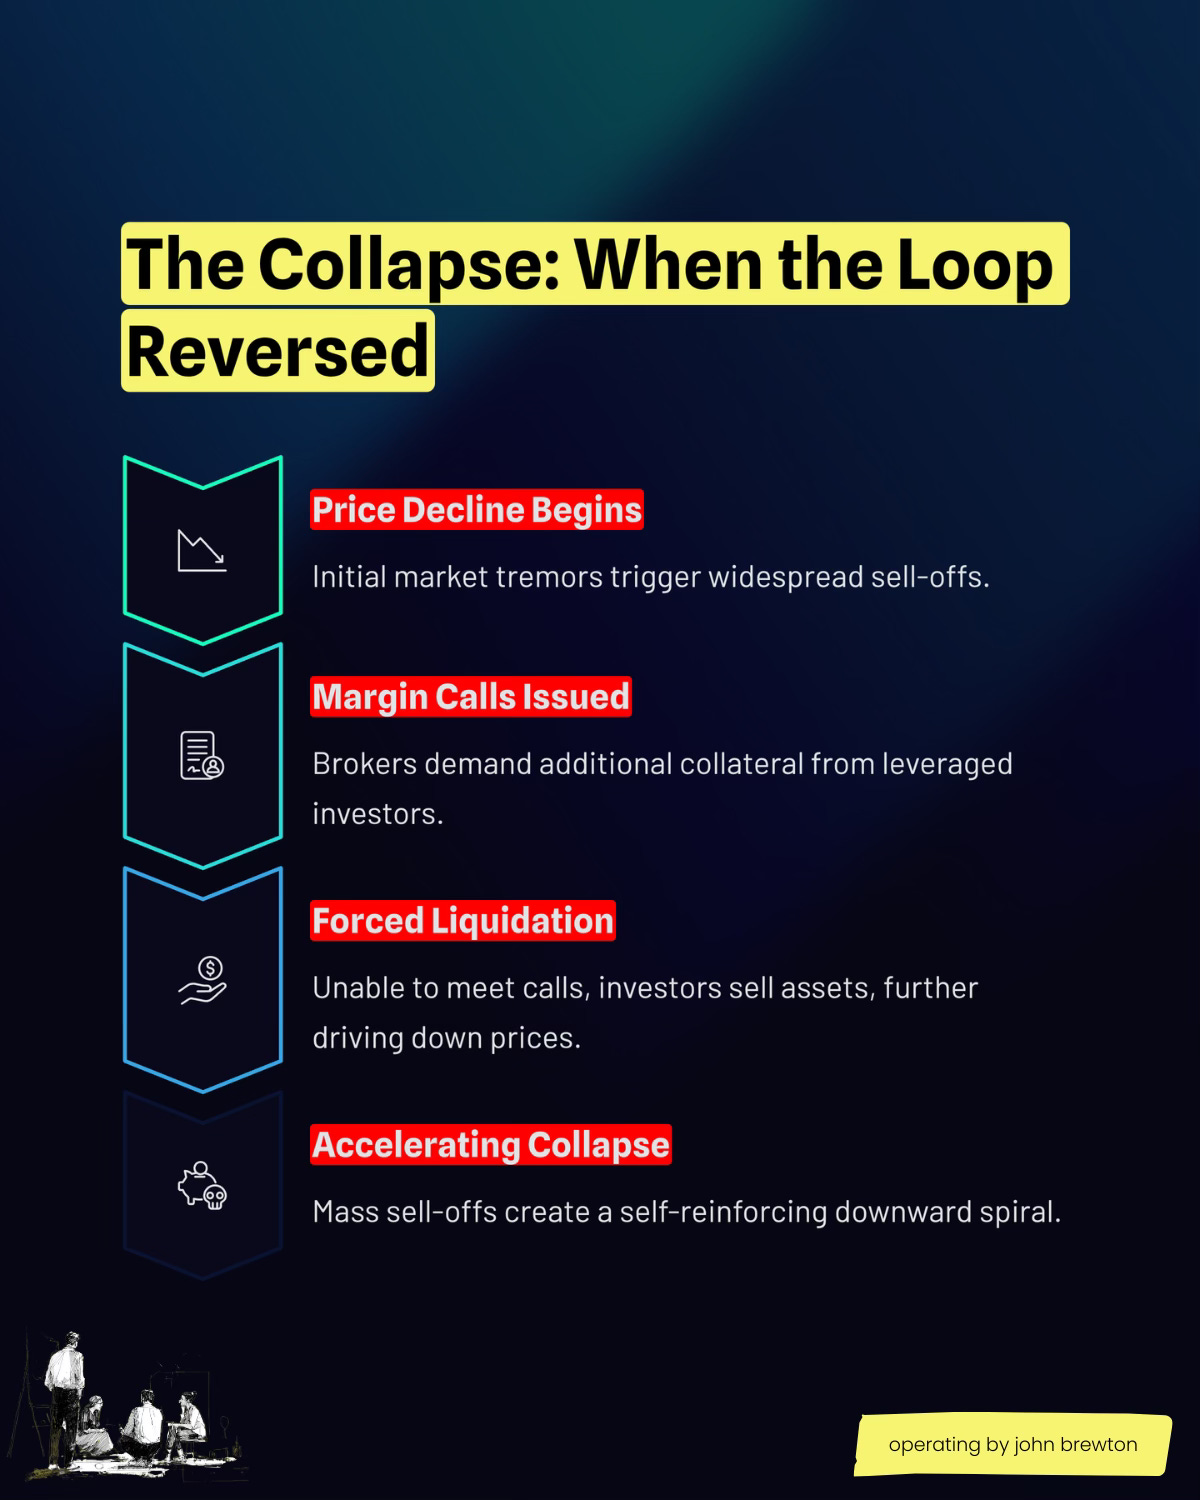
Falling prices → margin calls → forced selling → lower prices → more margin calls
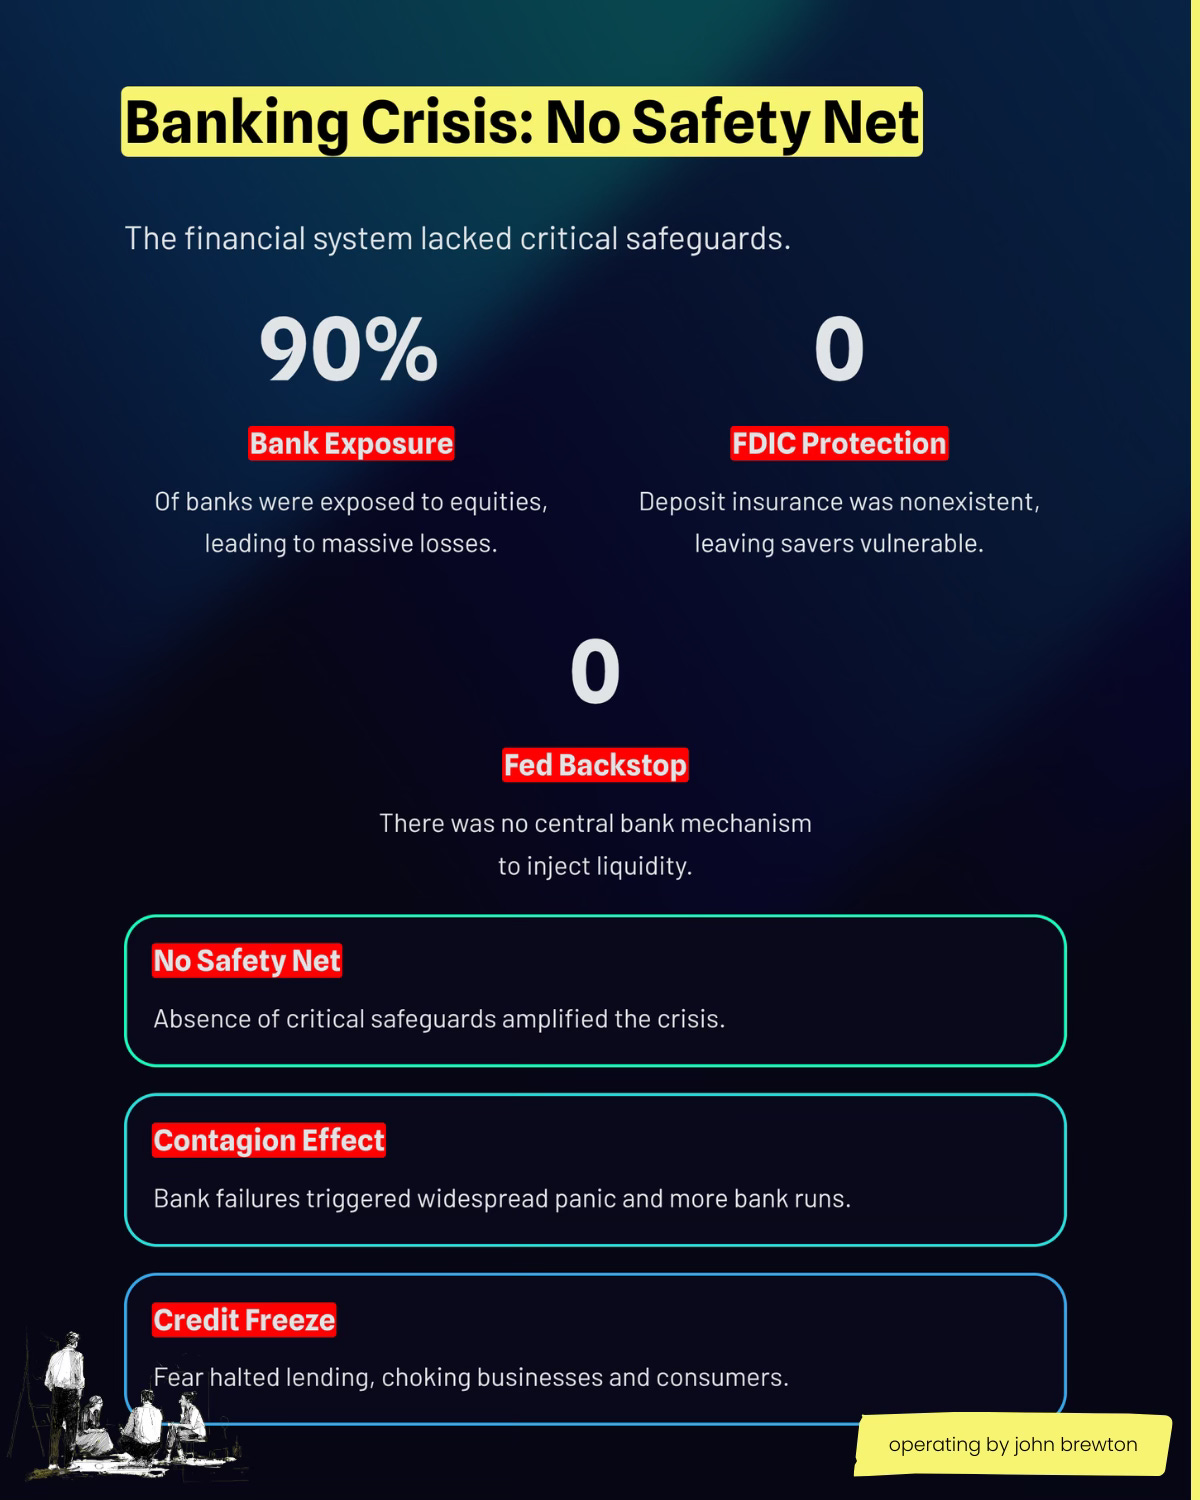
Bank exposure → 90%+ of banks had invested in stocks, many made direct margin loans to investors
No safety net → no FDIC, no deposit insurance, no Fed backstop capability
When stock prices fell 12.8% on Black Monday (October 28) and 11.7% on Black Tuesday (October 29), margin calls cascaded through the system. Investors who couldn’t meet requirements had entire portfolios liquidated, creating panic selling that drove prices lower still.
Superficial Similarities to Today
The parallels are eerie:
Market Concentration: 38% in Magnificent 7 today vs. 18% in utilities in 1929
Speculation Psychology: “Everyone” in the market then; FOMO driving AI stock purchases now
New Technology Driving Optimism: Radio, automobiles, electricity then; AI now
“New Era” Thinking: “Permanent prosperity” then; “AI will transform everything” now
Warning Signs Ignored: Fed warnings about speculation then; central bank bubble warnings now
The New York Times observes that today’s market, like 1929, features extraordinary concentration in a handful of companies driving nearly all gains.
Operating by John Brewton goes deep on what it takes to build, scale, and optimize modern companies. This breakdown analysis is just the starting point. Check out last week’s analysis of Amazon’s current operating strategy to see more.
What Paid Subscribers Get:
📬 3x Weekly Operating Notes – Short, actionable insights on corporate strategy, operating excellence, and business history
📊 Epic Operating Resource Articles – Deep-dive case studies and frameworks (like the Carnegie, Sloan, and Grove comparisons) available exclusively to paid members
💬 Paid Subs-Only Chat & Operating Working Group – Direct access to John and a community of operators tackling real challenges
🎙️ Quarterly Live Operating Q&A – Community working sessions where we break down current strategies and answer your questions
Operating Founders get even more:
🤝 Quarterly 1:1 Operating Sessions with John – Four 30-minute private sessions per year to work through your specific operating challenges
Plans:
Monthly: $17/month
Annual: $95/year (save 54%)
Operating Founder: $550/year (includes 1:1 sessions)
Most importantly, thank you for reading! I’d love for you to join our growing community and help you solve your biggest operating conundrums in any way I can.
Critical Differences: Why 1929 Won’t Repeat
Here’s where the parallel breaks down, and why a 1929-style systemic collapse is highly unlikely today:
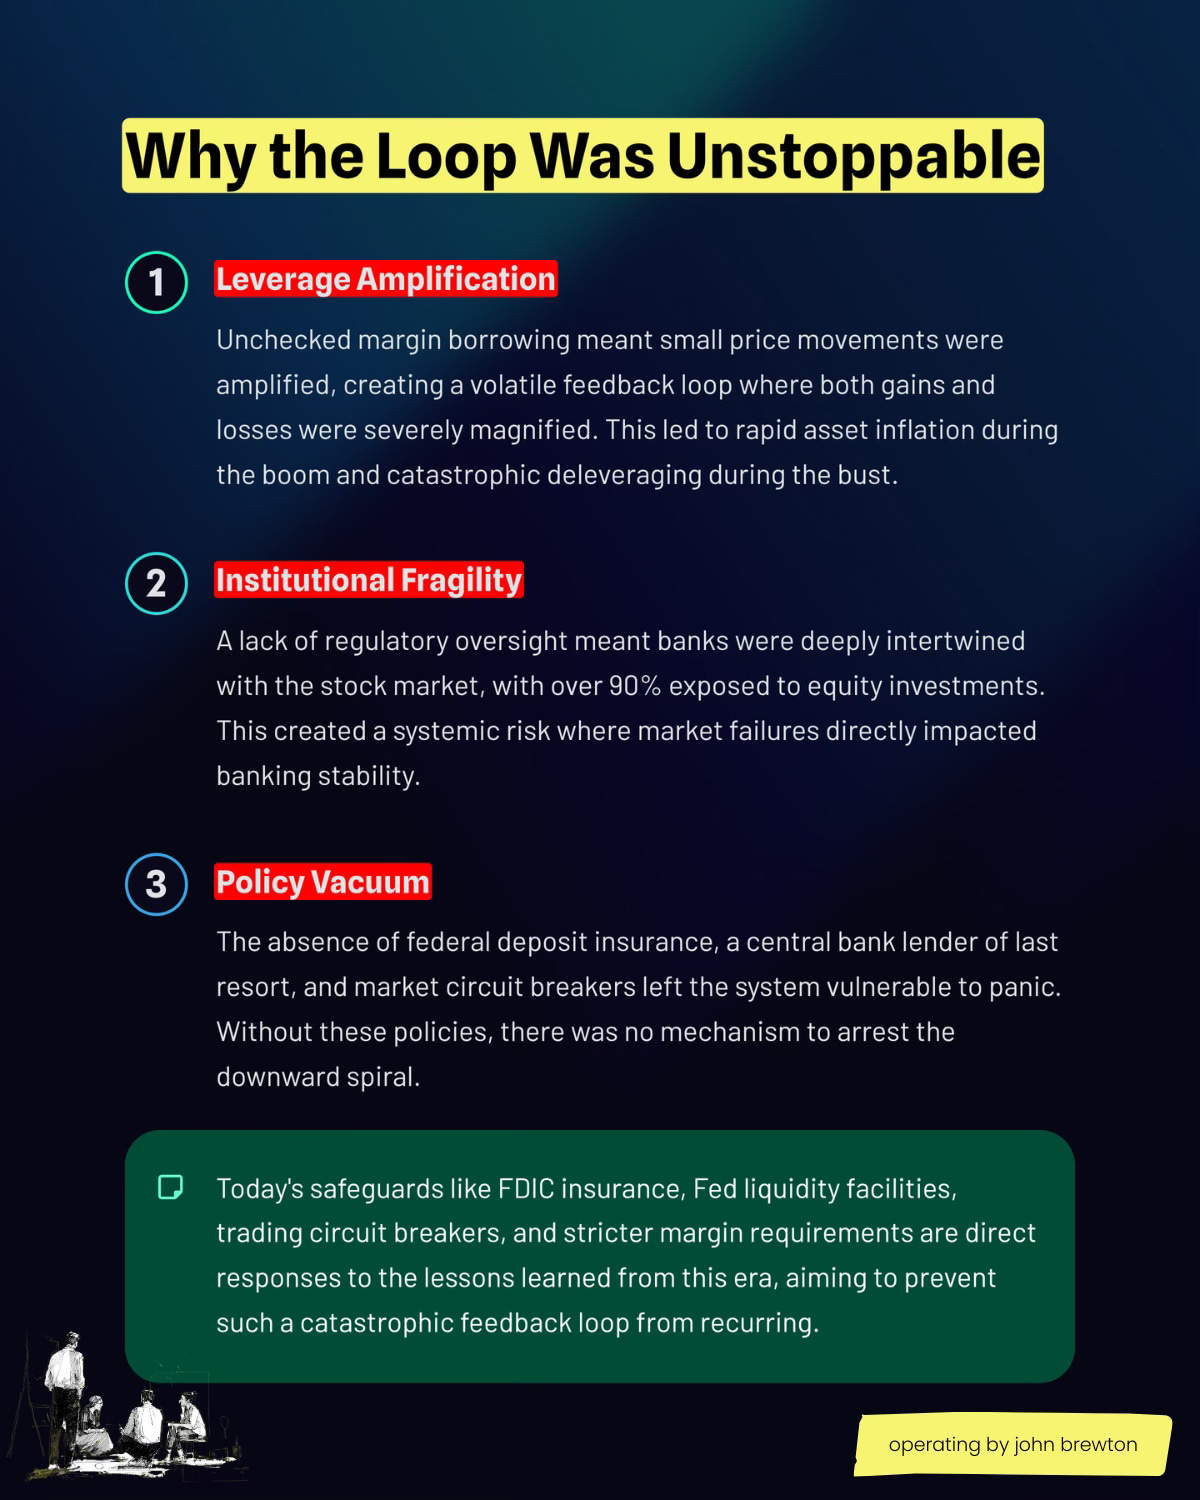
1. Leverage: The Decisive Factor
1929: 9.6% of GDP in margin debt, with 10:1 to 20:1 leverage ratios enabling massive speculation
2025: Total margin debt stands at roughly $1.1 trillion, just 3.8% of GDP ($28.8 trillion). More critically, the New York Times notes that “today, no more than half of the purchase price of a stock may be borrowed.” This 50% margin requirement versus the 10-15% of 1929 matters.
Most importantly, AI investment is primarily equity-funded from corporate cash flow, not borrowed money. The Wall Street Journal reports that Andreessen Horowitz’s Martin Casado observed: “The companies investing heavily in AI have established businesses...with hundreds of billions in reserves.”
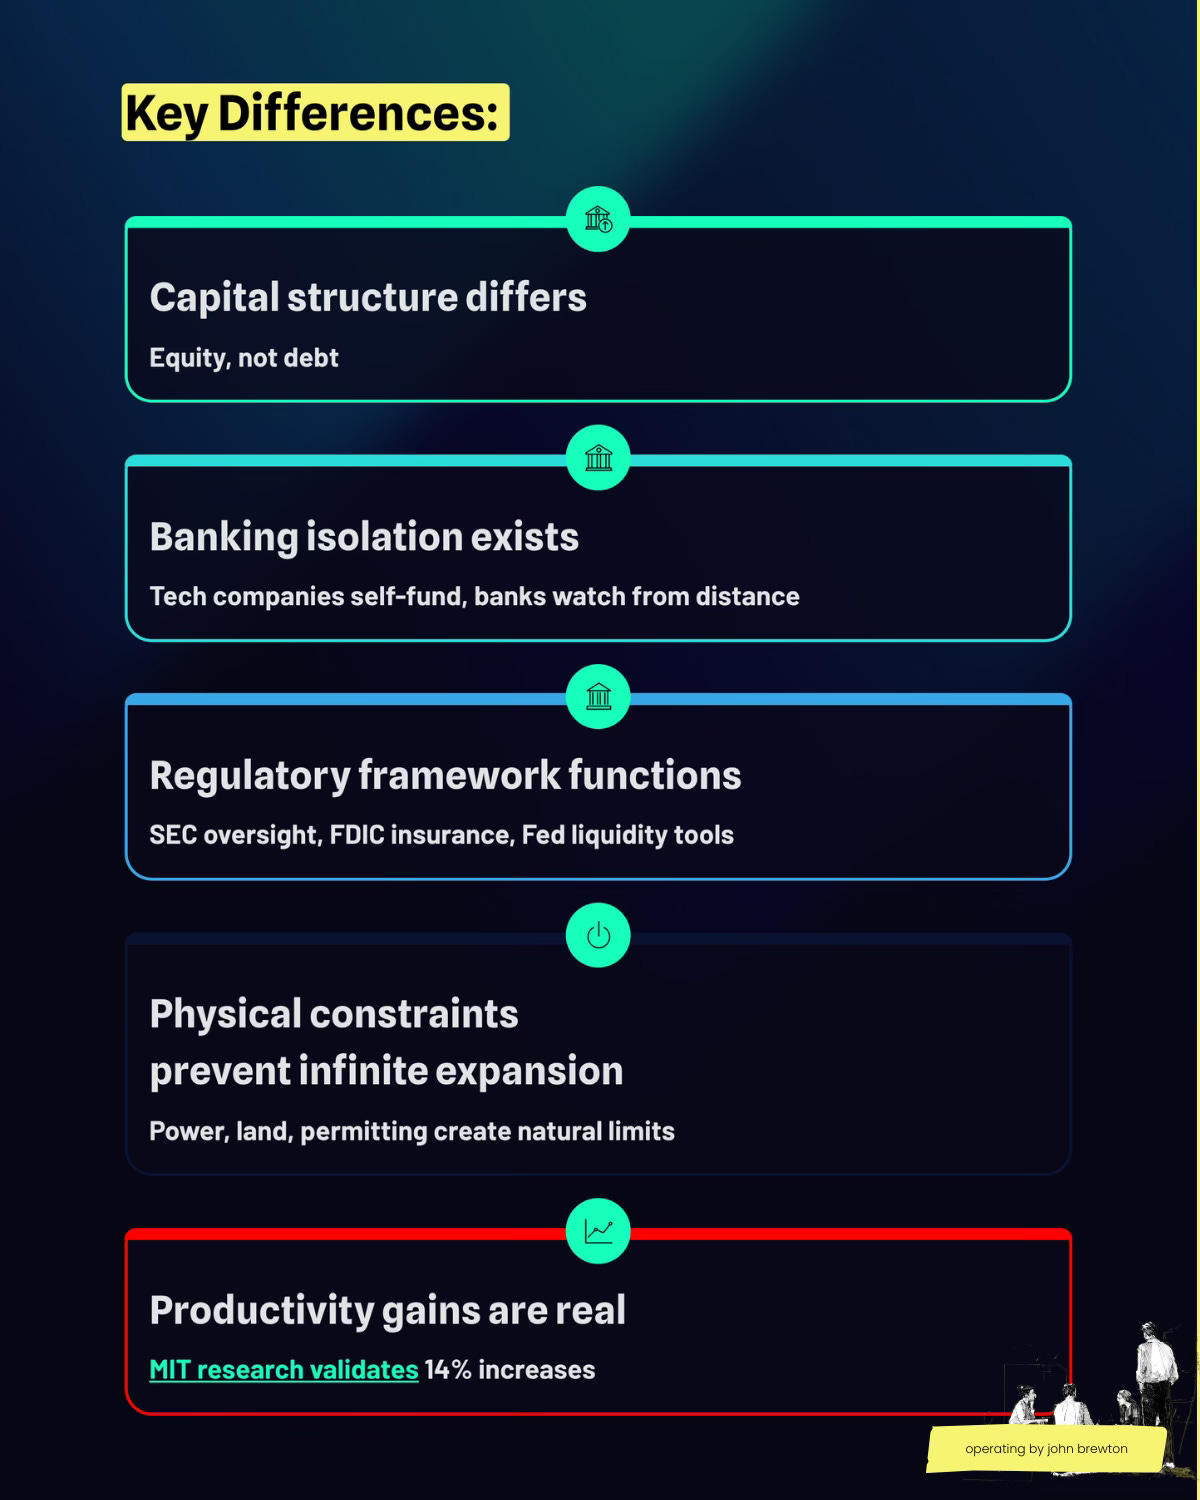
The absence of massive leverage means the death spiral mechanism that destroyed 1929 doesn’t exist. Equity losses hurt shareholders, but they don’t force cascading liquidations that crash the entire system.
2. Banking System Exposure
1929: 90%+ of banks held stocks directly and made margin loans to investors. When stocks crashed, banks failed. The New York Times details: “In 1929...banks were insufficiently capitalized...approximately 9,000 banks failed.”
2025: Banks are largely isolated from AI stock risk through Volcker Rule restrictions on proprietary trading. The Financial Times notes that while “$200bn+ ‘flood’ of AI-related issuance” has hit credit markets, this debt is held primarily by non-bank lenders and institutional investors, not core banking operations.
Most critically: FDIC insurance protects deposits up to $250,000, preventing the bank runs that turned 1929’s stock crash into systemic collapse. The Federal Reserve has unlimited liquidity tools, a far cry from gold standard constraints that prevented 1929-era intervention.
3. Regulatory Framework
1929: Virtually no regulation. No Securities and Exchange Commission (created 1934), no margin requirements enforced by the Federal Reserve (authority granted 1934), no disclosure requirements for publicly traded companies. Insider trading was legal; market manipulation widespread.
2025: Extensive oversight through the SEC, FINRA regulation of brokerage firms and margin requirements, Federal Reserve supervision of systemically important institutions, mandatory disclosure requirements, insider transaction reporting, and circuit breakers that halt trading during extreme volatility (implemented after the 1987 crash).
4. Monetary Policy Tools
1929: The gold standard prevented Federal Reserve response. The Fed couldn’t print money or provide unlimited liquidity without triggering gold outflows. The Economist’s historical analysis notes this constraint was fatal: “The Fed’s hands were tied by the gold standard.”
2025: Unlimited fiat currency enables QE, liquidity facilities, emergency lending programs. The Fed has a complete playbook from 2008 and the political will to deploy it in a worst-case scenario.
5. Economic Context
1929: The economy was already weakening before the crash. Agricultural depression throughout the 1920s due to overproduction, falling wages, low purchasing power weakening consumer demand, rising unemployment even before October.
2025: Unemployment sits at 4.2%—historically low. GDP is growing, with AI investment contributing significantly. Corporate earnings remain strong: the Magnificent 7 grew earnings 31.7% year-over-year in Q4 2024 versus 16.9% for the S&P 500.
6. Asset Type
1929: Speculation on existing companies. No new productive capacity was created, just higher prices for the same assets.
2025: Building actual infrastructure. The Financial Times details that McKinsey’s $5.2 trillion projection breaks down into “$3.1T (60%) to technology developers for chips and computing hardware, $1.3T (25%) to power generation/transmission, $0.8T (15%) to land, materials, site development.” These are physical assets that will exist regardless of stock valuations.
Bottom Line on 1929
In GDP-adjusted terms, the AI boom’s capital deployment ($5.2 trillion by 2030) is roughly 25% of what 1929 destroyed ($20+ trillion in 2025 dollars). But scale matters far less than structure.
The mechanisms that created 1929’s systemic collapse (extreme leverage, direct bank exposure, no regulatory framework, gold standard constraints, speculation without productive asset creation) simply don’t exist today.
An AI bubble bursting would hurt technology shareholders severely. But absent the leverage death spiral and banking system failure that defined 1929, it won’t trigger Great Depression 2.0.
III. Historical Parallel #2:
The 2008 Financial Crisis
If 1929 shows what happens when leverage meets no safety net, 2008 shows what happens when complex leverage meets interconnected institutions. Does the AI boom share 2008’s DNA?
Subprime’s Systemic Poison
The numbers tell a grim story. At the 2008 peak, outstanding U.S. mortgages totaled $10.6 trillion, with $1.5 trillion in subprime loans. The Economist’s detailed analysis notes that “loans were doled out to ‘subprime’ borrowers with poor credit histories who struggled to repay them.”
Total losses in loans and securities reached $3.6 trillion. Consumer wealth destruction hit $4.2 trillion. Employment losses totaled 8.7 million jobs, roughly 6% of the workforce. Unemployment peaked at 10% in October 2009.
But 2008 wasn’t just about mortgage losses, it was about how those losses spread. Complex derivatives (CDOs, MBS) distributed risk so opaquely that no one knew who held toxic assets. Banks held these assets directly on balance sheets. When housing prices fell by 20% or more, mortgage defaults triggered bank losses, which in turn led to credit freezes, ultimately contributing to an economic collapse.
The Lehman Brothers bankruptcy in September 2008 catalyzed global panic, necessitating $700 billion in TARP funding, as well as Federal Reserve unlimited QE, to prevent total system failure.
Similarities to the AI Boom
The parallels give pause:
Meta’s $25 billion bond sale to fund AI infrastructure, OpenAI’s $400 billion in commitments, and Nvidia’s $100 billion investment in OpenAI create webs of interdependency that could unravel if a single major player stumbles.
Why 2008 Won’t Repeat
Despite concerning parallels, the AI boom differs from 2008 in fundamental ways:
1. Debt vs. Equity: The Fundamental Distinction
2008: Leverage-driven, with debt everywhere. Mortgages at 90%+ loan-to-value ratios. Banks lending against inflated home values. Derivatives magnifying exposure.
2025: Equity-funded from corporate cash flow. The IMF’s Chief Economist explicitly noted that “this investment is not underpinned by borrowing, which implies that if a market correction occurs, certain shareholders may face losses” but the broader financial system and banking sector would likely remain insulated.
The Wall Street Journal’s analysis emphasizes: “The companies investing heavily in AI have established businesses...with hundreds of billions in reserves.” Microsoft, Google, Amazon, Apple, and Meta are funding AI from operating cash flow, not external debt markets.
This structural difference is decisive. Debt creates cascading failure when assets decline in value (as with mortgages). Equity losses hurt shareholders but don’t force liquidation spirals.
2. Asset Characteristics
2008: Existing homes that depreciated 20%+ in value. When prices fell, collateral became insufficient, triggering defaults and foreclosures. The assets were worth far less than the loans.
2025: New infrastructure retaining productive value. Data centers, semiconductor fabs, power plants, fiber networks. Even if underutilized initially (like dark fiber after the dot-com crash), these assets have alternative uses and eventual value.
The Wall Street Journal’s 2012 retrospective on “Optical Delusion? Fiber Booms Again, Despite Bust” shows how 2001’s “wasted” fiber investment became the backbone of today’s internet. Physical infrastructure endures.
3. Banking System Exposure
2008: Banks held mortgage-backed securities directly on balance sheets at high leverage ratios. Interconnected derivatives meant bank failures cascaded globally.
2025: Tech companies are self-funding. Banks have indirect exposure through private credit markets, but the New York Times reports that while private credit has grown to “approximately $2 trillion industry,” it remains separate from core banking operations. Fed Boston research shows banks “retain indirect exposure to the credit risk of private credit...but the banking system remains liable—through lending facilities,” not direct holdings.
4. Transparency
2008: Opaque derivatives. Hidden leverage. No one knew who held toxic assets until Lehman failed.
2025: Public company reporting provides transparent quarterly capex disclosures. The Financial Times tracks exactly where every dollar goes: chips, data centers, power generation. We can see exactly what’s being built and who’s paying for it.
5. GDP Percentage
2008: Mortgage debt at peak represented approximately 6.4% of GDP, enough to be systemically significant.
2025: AI investment currently represents roughly 1.2% of GDP. Fortune notes it added “0.5% to GDP growth” in early 2025, but from a lower base than 2008’s housing concentration.
While growing, AI investment hasn’t yet reached the systemic penetration that led to the collapse of the housing economy.
6. The Fed’s Playbook
2008: The Fed learned lessons and developed crisis tools during the meltdown itself. The response was improvised under extreme pressure.
2025: Unlimited liquidity facilities already exist. The Fed has a tested playbook: QE, emergency lending, coordinated central bank action. FDIC insurance prevents bank runs. Resolution authority enables orderly failures.
Stanford GSB research from 2018 noted that while “we aren’t nearly as safe as we could be,” the regulatory and institutional framework is incomparably stronger than pre-2008.
The Private Credit Wild Card
Here’s where 2008 parallels become concerning. The New York Times reports that private credit has grown to “$2 trillion industry, approximately five times its size in 2009.” Some firms, like Apollo, have “even launched their own insurance companies to funnel premiums into their private credit funds.”
Former Goldman Sachs CEO Lloyd Blankfein warns that private credit players “are underestimating the amplification of risks.” JPMorgan’s Jamie Dimon has warned that private credit could trigger the next financial crisis.
The concern: If AI companies funded through private credit begin defaulting, and those losses cascade through insurance companies and pension funds holding private credit exposure, could we see 2008-style contagion?
Possibly. But the scale remains far smaller than 2008’s mortgage exposure, and the linkages to systemically important banks appear more attenuated. It’s a risk worth monitoring closely, not a certainty.
Bottom Line on 2008
The AI boom’s capital scale (roughly $5.2 trillion by 2030) exceeds 2008’s total losses ($3.6 trillion). But leverage profile fundamentally differs. Equity-funded infrastructure investment ≠ debt-fueled housing speculation.
An AI correction would likely resemble a contained tech sector unwind rather than systemic banking crisis, more like the dot-com crash (painful for investors, manageable for the economy) than 2008’s near-death experience.
IV. The Bezos Thesis
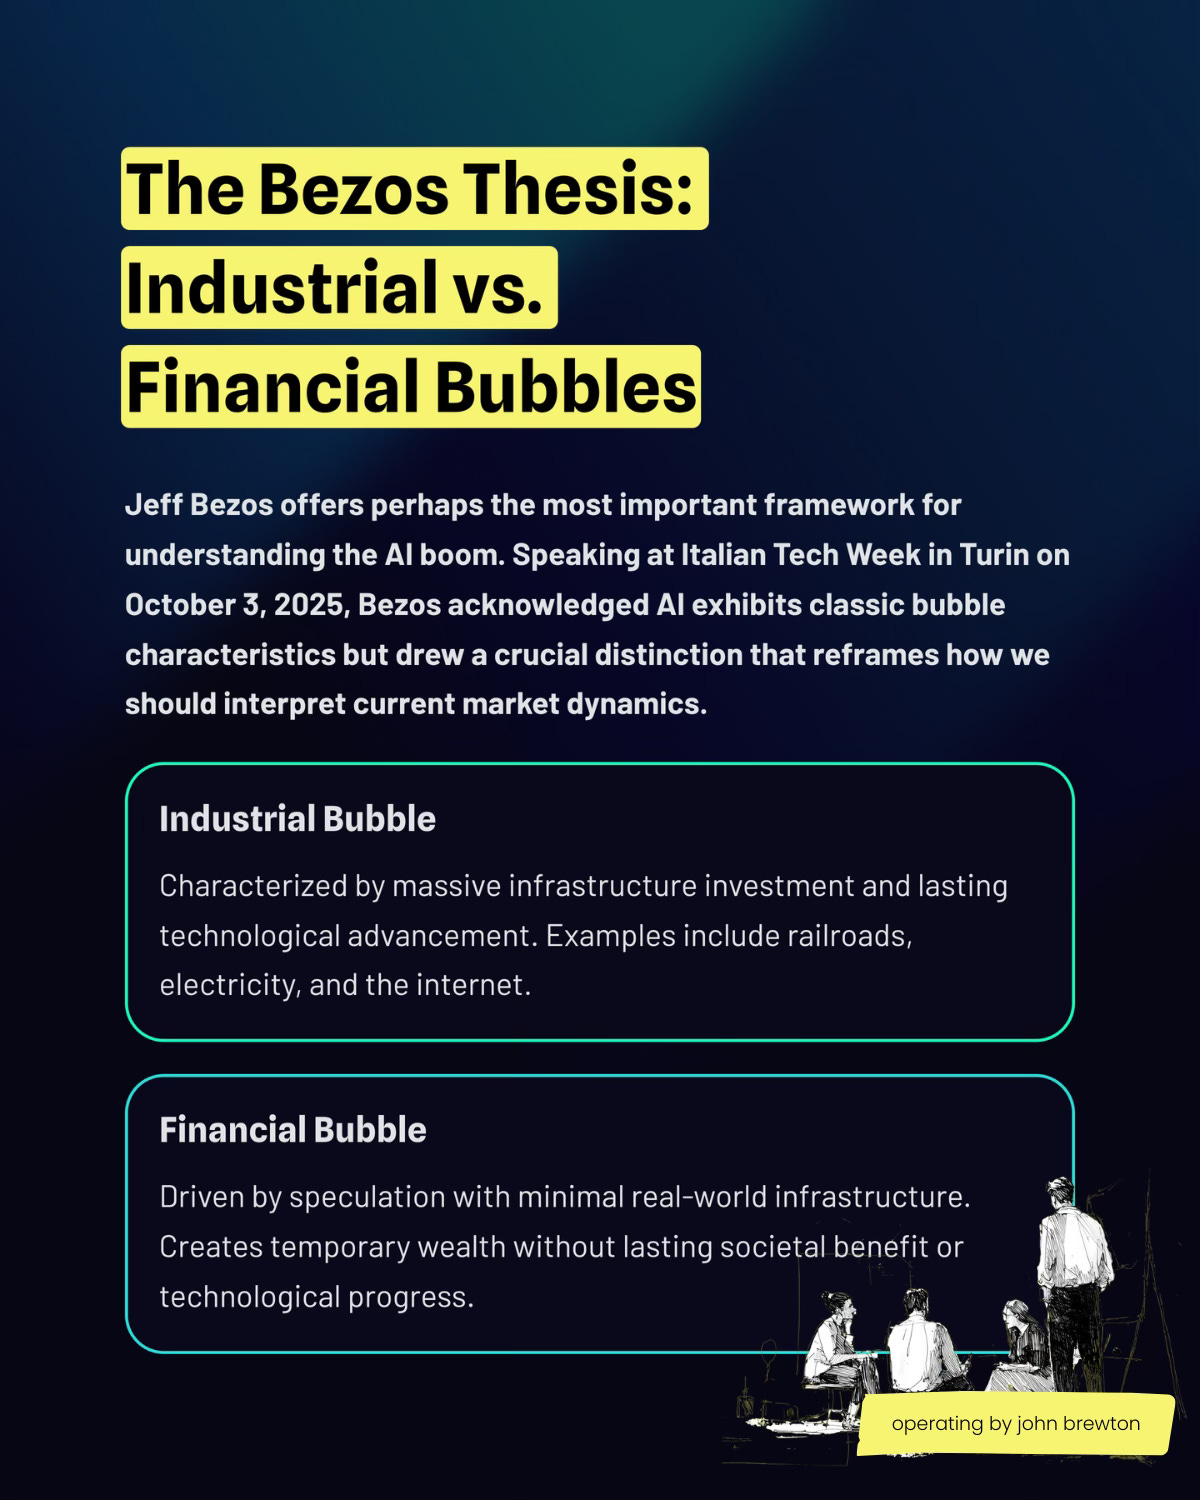
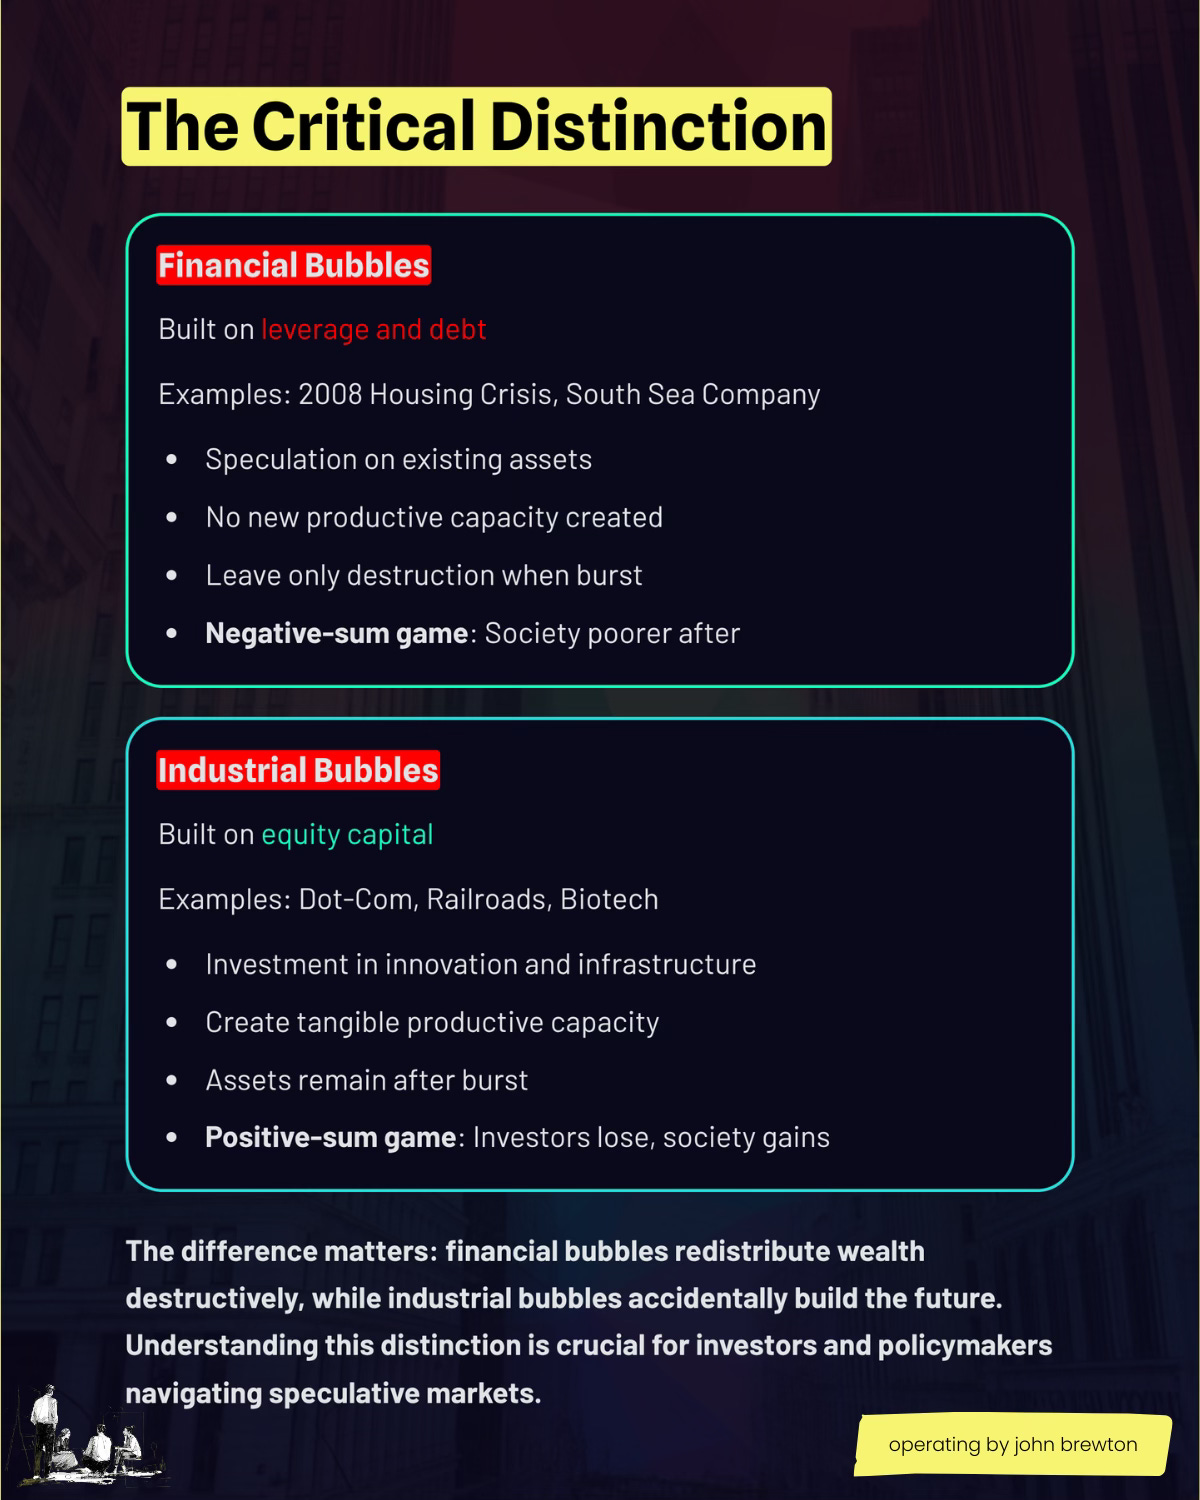
The Core Distinction
Harvard Business School’s Andy Wu elaborates on this framework: “A bubble is when everyone can see the value creation, but no one is thinking about the value capture...Pets.com went bankrupt [in 2000], but today you’ve got Chewy.com doing essentially the same thing. Investors in Pets.com lost everything. But society walked away with a proven business model and infrastructure.”
Applying the Framework to AI
Does today’s AI boom fit the industrial bubble pattern? Evidence suggests yes:
1. Equity-Funded Infrastructure
The Financial Times details that McKinsey’s $5.2 trillion projection breaks down into actual physical assets: $3.1T for technology hardware (chips, servers), $1.3T for power generation and transmission, $0.8T for land, materials, and site development.
Concrete, steel, silicon, and power plants.
2. Real Physical Constraints
Unlike purely financial bubbles that can expand infinitely, AI faces hard limits. The Financial Times reports proposed data centers require “50-134 gigawatts” of power (one gigawatt powers 1.1 million homes for an hour), but U.S. utilities have committed only 64 gigawatts of new supply.
Household electricity prices rose 6.5% year-over-year (May 2024-2025), with 70% of increased costs in mid-Atlantic grid attributed to data center demand. Physical constraints, power, land, permitting, supply chains—will naturally moderate investment before it reaches unlimited extremes.
3. Horizontal Technology with Universal Application
Bezos emphasized AI’s unique characteristic: “The biggest impact that AI is going to have is it is going to affect every company in the world. It is going to make their quality go up and their productivity go up. I literally mean EVERY company. Every manufacturing company. Every hotel. Every consumer products company, etc, etc, etc.”
MIT Sloan/NBER research by Brynjolfsson, Li, and Raymond provides empirical evidence: Their study of 5,179 customer support agents found 14% productivity increase on average, with 34% gains for novice workers. “AI assistance increases customer sentiment, increases employee retention,” the researchers documented.
This is the opposite of sector-specific speculation—it’s infrastructure with economy-wide utility.
4. Actual Revenue and Profits
Fed Chair Powell emphasized repeatedly: “I won’t go into particular names, but they actually have earnings. These companies actually have business models and profits and that kind of thing. So it’s really a different thing” than the dot-com bubble.
Goldman Sachs research notes the Magnificent 7 “grew their earnings per share in Q2 by 26% year on year. So there is real money fueling a real business,” not cash-burning speculation.
Even “Good” Bubbles Crush Investors
Bezos’s framework validates that society benefits. But Harvard’s Andy Wu warns that doesn’t protect individual investors: “Investors in Pets.com lost everything. But society walked away with a proven business model.”
The Wall Street Journal notes troubling parallels: “Unlike the dot-com boom’s fiber cables, the latest AI chips rapidly depreciate in value as technology improves.” GPT-5 reportedly cost $5 billion to develop but offered minimal improvement over GPT-4—suggesting diminishing returns may arrive faster than dark fiber’s eventual utilization.
And Wharton’s Lynn Wu research adds nuance:
“If you invest in AI, you might not see the innovation you expect.” AI excels at “new combination innovation” (generating 4 new patents/year, 3.5% revenue increase) but “AI might not deliver the outcome you’re hoping for if you’re looking at radical innovation.”
Synthesis
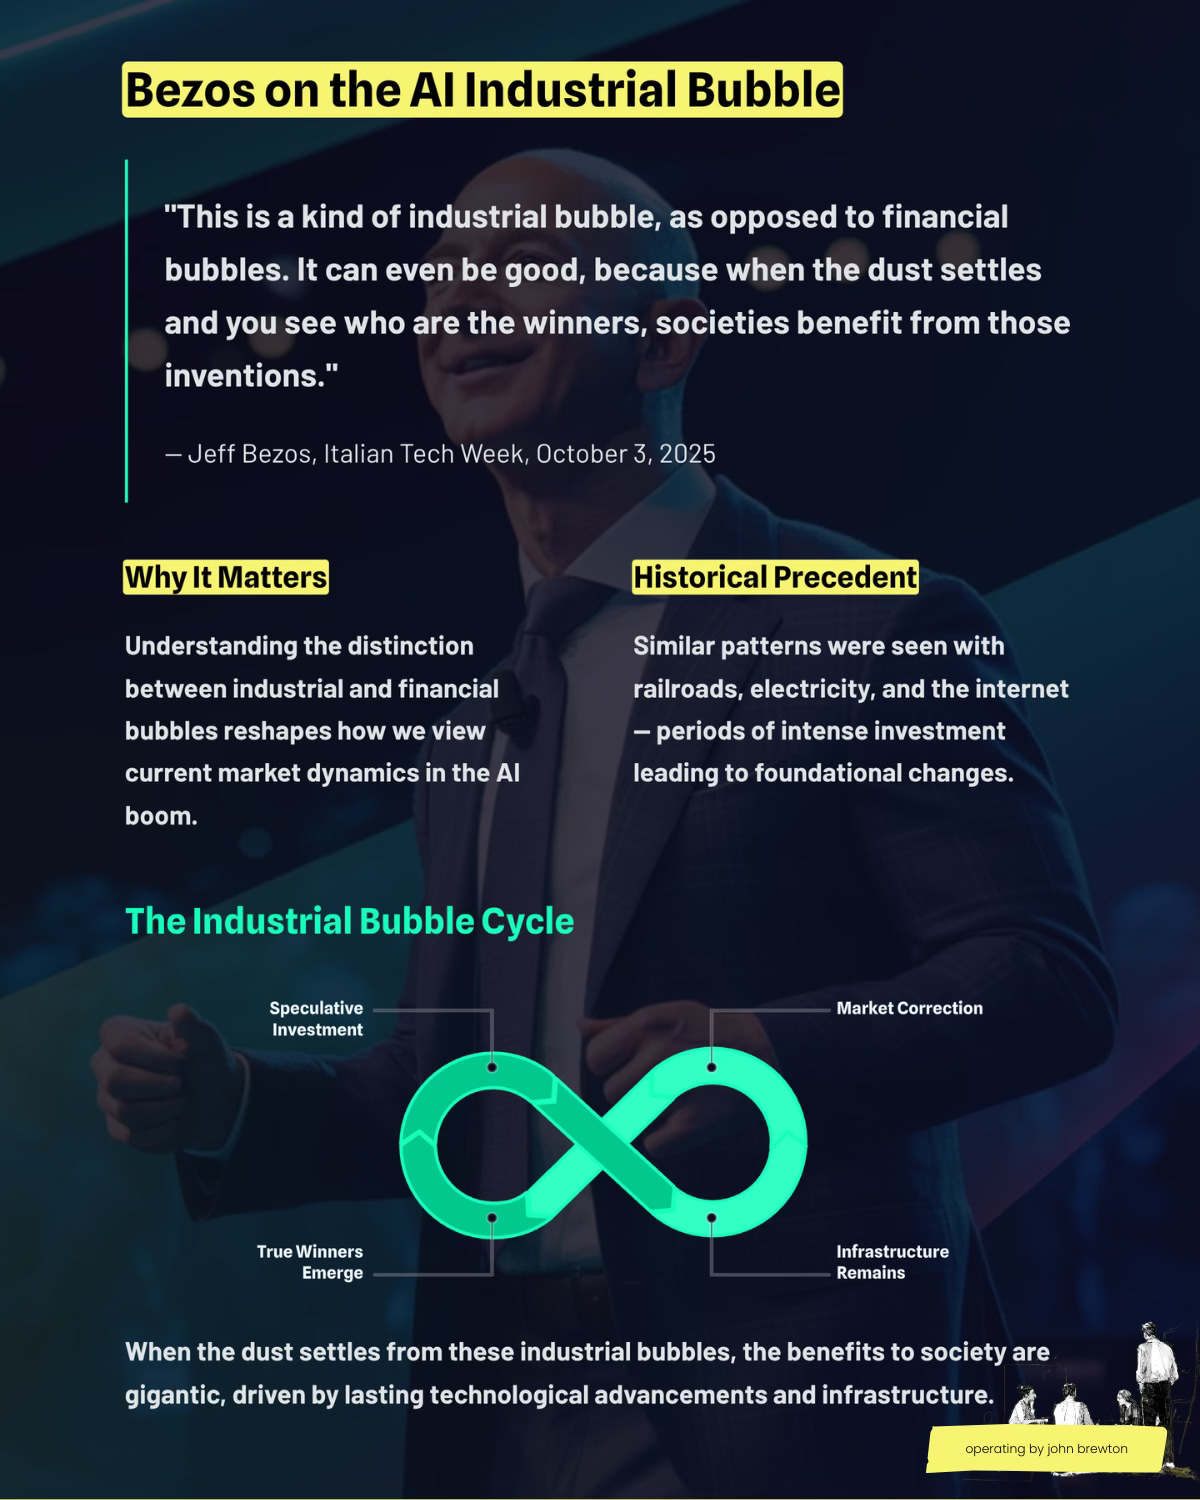
Bezos is directionally correct: The AI boom is creating real infrastructure with lasting value. Data centers, chips, and power generation will outlast any stock market correction, just as fiber optics outlasted the dot-com crash.
But for individual investors and operators, the lesson remains sobering: You can be right about the technology and still go bankrupt being early. The infrastructure will provide value to society and future companies. Whether it provides returns to today’s investors at today’s prices is an entirely different question.
V. Why This Time Really Is Different
Now we arrive at the central argument: The AI boom exhibits bubble characteristics, but its structure makes 1929/2008-style systemic collapse highly unlikely. Here’s why operators can position confidently despite the noise.
1. The Leverage Differential (Most Important)
Let’s put this in stark perspective:
1929: 9.6% of GDP in margin debt
2008: 6.4% of GDP in mortgage debt at peak
2025: 1.2% of GDP in AI investment
The New York Times analysis shows that in both 1929 and 2008, “Every great panic in modern finance has started the same way: too much borrowed money.” In 1929, it was margin loans. In 2008, it was subprime mortgages. In both cases, “banks were insufficiently capitalized.”
Today? The Wall Street Journal reports that Martin Casado of Andreessen Horowitz observed: “The companies investing heavily in AI have established businesses...with hundreds of billions in reserves.”
The Magnificent 7 are cash-rich, not debt-laden. They’re funding AI infrastructure from operating cash flow, not borrowed money. This fundamental difference in capital structure prevents the death spiral that defined past crises:
1929/2008: Debt → margin calls/defaults → forced selling → more debt distress → system failure
2025: Equity losses → shareholder pain → contained to investors → no cascading leverage
MIT’s research showing 14% productivity gains provides evidence that these investments may actually pay off, unlike pure speculation.
2. The Banking System Firewall
Direct vs. Indirect Exposure
1929: Banks made margin loans, held stocks directly
2008: Banks held MBS on balance sheets
2025: Tech companies self-funding, banks largely watching from sidelines
The Financial Times notes that while “$200bn+ ‘flood’ of AI-related issuance” has hit credit markets, these bonds are held primarily by institutional investors, not core banking operations.
The key risk—private credit exposure—remains concerning but separate. The New York Times reports that Fed Boston research shows banks “retain indirect exposure to the credit risk of private credit...but the banking system remains liable—through lending facilities” rather than direct holdings.
Safety Nets Now Exist
Modern financial architecture includes multiple firewalls absent in past crises:
FDIC insurance ($250k per account) prevents 1929-style bank runs
Fed unlimited liquidity tools enable instant intervention (unlike gold standard)
Circuit breakers halt panic selling automatically
Resolution authority enables orderly failure of systemically important institutions
Stanford GSB research from 2018 notes that while “we aren’t nearly as safe as we could be,” the regulatory and institutional framework is incomparably stronger than 1929 or even pre-2008.
Regulatory Guardrails
SEC oversight and mandatory disclosure requirements
50% margin requirements (vs. 10-15% in 1929)
Stress tests for systemically important banks
Volcker Rule restrictions on proprietary trading
Chicago Booth research on market concentration notes that “if concentration is growing but market power isn’t, the antitrust establishment may be doing exactly what it should”—suggesting oversight is functioning.
3. The Productive Asset Base
Real Infrastructure Being Built
The Financial Times breaks down the $5.2 trillion McKinsey projection:
$3.1T (60%) to technology developers for chips, servers, computing hardware
$1.3T (25%) to power generation and transmission infrastructure
$0.8T (15%) to land, materials, site development
These are tangible, physical assets with alternative use cases:
Data centers can be repurposed for cloud computing, research, rendering, cryptocurrency mining
Chips have applications across computing, automotive, defense, consumer electronics
Power plants serve the broader electrical grid
Fiber networks support future technologies we haven’t yet imagined
Recovery Value
Unlike 2008’s foreclosed homes (worth 20%+ less than loans) or worthless 1929 stock certificates, physical infrastructure retains value. The Wall Street Journal’s dark fiber analysis shows how “wasted” 1990s investment became today’s internet backbone.
Even in worst-case scenarios, data centers can be acquired at fire-sale prices by companies with longer time horizons, exactly what happened with dark fiber networks in the early 2000s.
HBS research on AI value creation shows “0.5% annual increase in value premium for AI-suited industries,” suggesting infrastructure creates lasting competitive advantages even if initial investors don’t capture returns.
4. The Economic Context
Strong Fundamentals vs. Weakness
1929: Agricultural depression, falling wages, rising unemployment
2008: Housing bubble masking economic problems
2025: 4.2% unemployment, GDP growing, profits strong
Fortune reports that “AI spending added 0.5% to GDP growth” in Q1-Q2 2025, with the Magnificent 7 growing earnings 31.7% year-over-year versus 16.9% for the broader S&P 500.
AI Contributing to Growth, Not Disguising Weakness
Fed Chair Powell emphasized that AI spending isn’t driven by monetary policy: “I don’t think interest rates are an important part of the AI or data-center story. It’s based on longer-run assessments that this is an area where there’s going to be a lot of investment, and that’s going to drive higher productivity.”
MIT’s research validates this: “14% productivity increase on average, 34% for novice workers” represents real gains, not speculative hope.
Bloomberg notes that “tech giants have largely justified their elevated valuations with profit growth that outstrips share-price appreciation”—83% of companies beat earnings estimates in recent quarters.
Not Cyclical Mania
Companies are “building for multi-decade horizon,” as The Financial Times observes. OpenAI’s expansion to “five new US data centres, pushing the cost of its AI infrastructure project Stargate to about $400bn” represents long-term infrastructure investment, not short-term speculation.
5. The Policy Response Capability
Unlimited Monetary Tools
Unlike 1929’s gold standard constraints, modern central banks have:
Quantitative easing
Unlimited liquidity facilities
Emergency lending programs
Coordinated international intervention (central bank swap lines)
The Fed has a complete playbook from 2008. The Economist’s analysis notes that while “interest-rate cuts may disappoint investors,” the Fed’s toolkit extends far beyond rates.
Fiscal Capacity
Government can support the economy if needed through:
Automatic stabilizers (unemployment insurance, food assistance)
Discretionary stimulus (if politically feasible)
No constraints like 1930s gold standard or balanced budget orthodoxy
International Coordination
The dollar as reserve currency (not gold) enables unlimited action without external constraints. Central banks learned coordination lessons from both 1929 and 2008.
6. Physical Reality Checks
Hard Infrastructure Limits
The Financial Times details that proposed data centers “require 50-134 gigawatts” of power, but utilities have committed only 64 gigawatts. Permitting, environmental reviews, community opposition, and supply chain constraints for specialized chips and cooling systems all slow buildout naturally.
These aren’t like margin loans that can expand infinitely with a phone call—they’re physical assets requiring land, permits, construction, and grid connections.
Natural Moderation Mechanism
Unlike purely financial speculation that can balloon without constraint, the AI boom faces real-world bottlenecks that prevent infinite expansion. You can’t build more data centers than the power grid supports, no matter how enthusiastic investors become.
7. The Concentration Paradox
Yes, 37% of the S&P 500 in seven stocks is unprecedented. But context matters.
Bloomberg’s analysis notes that from a global perspective, “the US is actually only the 5th-least concentrated” among major markets. India, Japan, China, and Canada all show lower concentration. France, Taiwan, and Switzerland show higher.
Chicago Booth research suggests concentration may reflect “genuine dominance in winner-take-all economy” rather than artificial bubble dynamics. Network effects, economies of scale, and data advantages create natural monopolization in digital markets.
This doesn’t eliminate risk, but it suggests the concentration may be structural rather than purely speculative.
VI. What Could Go Wrong
Balanced analysis requires acknowledging genuine risks. Not all potential problems lead to systemic crisis, but some scenarios deserve serious attention.
Scenarios That Don’t Lead to Systemic Crisis
1. Disappointing Monetization
What happens: Companies can’t generate the $2 trillion annual revenue Bain & Company estimates is needed by 2030 to justify infrastructure investment.
Result: Stock prices correct 50-70% (similar to dot-com). Shareholders get crushed. But the economy continues functioning.
Harvard’s Andy Wu notes this is the most likely outcome: “Value creation without value capture.” Society gains the infrastructure; early investors lose.
Wharton’s research adds nuance: “AI might not deliver the outcome you’re hoping for if you’re looking at radical innovation.” The technology may work but generate lower returns than priced in.
2. Overcapacity Becomes Apparent
What happens: Like dark fiber, 85-95% of AI infrastructure sits idle initially. Massive write-downs for tech companies.
Result: The Wall Street Journal’s analysis suggests this creates opportunity for patient capital: Infrastructure eventually utilized as technology matures and use cases develop. Fire-sale acquisitions by companies with longer horizons.
NBER research on implementation lags explains why: “Like other general purpose technologies, full effects won’t be realized until waves of complementary innovations are developed.” Overcapacity precedes utilization.
3. Technical Plateau
What happens: AI improvements hit diminishing returns. GPT-6 proves another $5 billion delivers minimal gains over GPT-5.
Result: Investment slows naturally as ROI becomes clear. But no financial contagion because spending was equity-funded, not leveraged.
Scenarios That Could Create Systemic Risk
1. Private Credit Unwind
The risk: The New York Times reports that private credit has grown to “$2 trillion industry, approximately five times its size in 2009.” AI-focused lending could create correlated defaults.
If AI companies funded through private credit begin failing, losses could ripple through:
Insurance companies (holding private credit exposure)
Pension funds (invested in private credit)
Banks (providing warehouse lending to private credit firms)
Former Goldman CEO Lloyd Blankfein warns that private credit players “are underestimating the amplification of risks.”
Why it’s containable: Private credit remains separate from core banking operations. Fed Boston research shows banks “retain indirect exposure” but not direct holdings that would trigger cascading failures. Losses would hurt specific institutions, not the entire banking system.
JPMorgan’s Jamie Dimon is actively warning about this risk, suggesting regulators are monitoring closely.
2. Circular Financing Cascade
The risk: OpenAI’s $400 billion in commitments against $20 billion in revenue. If OpenAI can’t fulfill obligations, Nvidia’s $100 billion investment becomes impaired. Cross-investments create contagion within tech sector.
Why it’s containable: The Financial Times notes circular financing is “mostly within tech sector.” Losses wouldn’t directly impact traditional banks, utilities, industrials, consumer companies. A tech sector problem, not an economy-wide crisis.
3. Job Displacement Accelerates
The risk: Fortune reports that “Since ChatGPT launched, job openings are down 30%,” with 946,000 layoffs announced in 2025 YTD.
Fed Chair Powell acknowledged the policy dilemma: “We have upside risks to inflation, downside risks to employment. This is a very difficult thing for a central bank, because one of those calls for rates to be lower, one calls for rates to be higher.”
NBER research by Acemoglu shows “automation creates displacement effect reducing labor demand, but productivity effect increases it.” The net effect remains uncertain.
Why it’s manageable: MIT’s research shows AI productivity gains are “concentrated in less-skilled workers”—helping rather than replacing them. “34% gains for novice workers” suggests AI can augment rather than eliminate jobs.
Unemployment remains at 4.2%—historically low. If displacement accelerates, fiscal policy (unemployment benefits, retraining) can cushion impacts in ways unavailable during 1929.
Why Even Worst Cases Are Likely Contained
Central banks are actively monitoring these risks. The Bank of England’s warning that “the risk of a sharp market correction has increased” shows regulators aren’t complacent.
The mechanisms that created 1929/2008 catastrophes, massive leverage creating cascading failures through interconnected banks, simply don’t exist at comparable scale today.
The Wall Street Journal’s Martin Casado quote captures the consensus view: “It’s challenging for me to envision that a speculative bubble would necessarily indicate a systemic crisis.”
VIII. Conclusion: Painful Correction, Not Apocalypse
We’ve traveled from the 1929’s leverage-driven collapse, to 2008’s debt contagion, the dot-com’s productive overcapacity, and today’s AI infrastructure boom.
Here is the picture that emerges:
The Synthesis
The Bezos Framework Validated
This is an industrial bubble, not a financial bubble. As Harvard’s Andy Wu observed, “A bubble is when everyone can see the value creation, but no one is thinking about the value capture.”
Society likely benefits even as investors suffer. The Financial Times documents $5.2 trillion creating actual infrastructure: data centers, chips, power plants. MIT research shows 14% productivity gains are real, not speculative.
Capital may be “wasted” in the short term. But we are restructuring productive capacity for decades.
Structure Matters More
The New York Times’ analysis of 1929, 2008, and today concludes: “Every great panic in modern finance has started the same way: too much borrowed money.” The AI boom, funded primarily from corporate cash flow, breaks this pattern.
Absent the leverage amplification and direct banking exposure that created past catastrophes, an AI bubble bursting would resemble a contained tech sector correction rather than systemic collapse.
Closing Thought
The AI boom may indeed be a bubble. The New York Times observes that “if any issues arise with these vital companies...the market may lack a solid foundation to rely on.”
But not all bubbles end in apocalypse. Understanding the difference between financial speculation (1929, 2008) and industrial overcapacity (dot-com, railroads) could be the most important investment insight of the decade.
As operators, we build for the long term. We understand that productive assets outlast stock prices. We know that cash flow beats borrowed hope. And we recognize that the best time to deploy capital is when others are panicking over distinctions they don’t understand.
The AI boom exhibits bubble characteristics. But its equity-funded, infrastructure-creating, productivity-enhancing structure makes systemic collapse highly unlikely.
Position for painful tech sector correction, but not economic apocalypse. And remember: the infrastructure being built today will power the economy of tomorrow, regardless of what happens to stock prices next quarter.
This is Part 1 of the Operator’s Investment Thinking series. Next: “The Operator’s Hedge: Why Boring Stocks Protect Operating Businesses.”
Want to discuss how you’re thinking about AI investment in your operations and portfolio? Reply with your biggest question. I read every response.
And if you found this valuable, share it with an operator friend trying to make sense of our world.
Master Source List For Further Reading
Wall Street Journal (WSJ)
“Here’s How Much the Magnificent Seven Matter to the Market” (Oct 30, 2025)
“AI Concentration: The so-called Magnificent Seven tech giants...”
“A Reckoning for the Magnificent Seven Tests the Market” (Apr 26, 2025)
“Why This Investor Says the AI Boom Isn’t the Next Dot-Com Crash”
Financial Times (FT)
“Meta readies $25bn bond sale as soaring AI costs trigger ...”
“Big Tech tests investors’ patience with $80bn AI investment”
“Credit market hit with $200bn ‘flood’ of AI-related issuance”
“Google Opens Waltham Cross Data Centre as Part of Two-year £ ...”
“Wall Street frets over Big Tech’s $200bn AI spending splurge”
Bloomberg
“AI Frenzy Fueling Tech Dominance Rewrites Asia’s Market ...”
“Dot-Com Fears Rise With Tech Stocks Seeing $100 Billion Swings”
“Scant Winners in S&P 500’s Record-Setting March Are Warning Sign”
“Tech Stocks Are Doing So Well Investors Are Starting to Worry”
New York Times (NYT)
The Economist
Fortune
“Tesla kicks off earnings season for Big Tech’s ‘Magnificent ...”
“Apollo economist: Mag 7 may not be the best AI investment ...”
Academic & Business School Resources
MIT/NBER: “Generative AI at Work” (Brynjolfsson, Li, Raymond)
MIT/NBER: “Measuring the Productivity Impact of Generative AI”
NBER: “Artificial Intelligence and the Modern Productivity Paradox”
Wharton: “How AI-powered Collusion in Stock Trading Could Hurt Price ...”
Stanford GSB: “Research: How the Fear of Missing Out Makes Investors Risk ...”
Stanford GSB: “Ten Years after the Financial Meltdown: What Have We ...”
If you’d like to work together, I’ve carved out some time to work 1:1 each month with a few top-notch Founders and Operators. You can find the details here.
John Brewton documents the history and future of operating companies at Operating by John Brewton. He is a graduate of Harvard University and began his career as a Phd. student in economics at the University of Chicago. After selling his family’s B2B industrial distribution company in 2021, he has been helping business owners, founders and investors optimize their operations ever since. He is the founder of 6A East Partners, a research and advisory firm asking the question: What is the future of companies? He still cringes at his early LinkedIn posts and loves making content each and everyday, despite the protestations of his beloved wife, Fabiola, at times.






Absolutely great article here. Well researched with lots of information and visuals. Thank you! These are going to be very interesting times to say the least.
The Apollo insurance-to-private-credit pipeline is a fascineting case study of how alternative asset managers are creating captive funding sources beyond traditional pension and endowment capital. What makes this cycle different isn't just the AI infrastructure angle, but how financial plumbing has evolved to absorb excess capital without triggering systemic leverage cascades. The liquidity buffers and regulatory frameworks post-2008 mean you can have frothy valuations without necessarily getting a Lehman moment. Still, the Bezos analogy cuts both ways since plenty of those railroad investors got wiped out even if society benefited long term.