
Why Enterprise AI Pilots Stall, and the 51 That Didn’t
Stanford studied 51 enterprise AI deployments that succeeded. The bottleneck was the organization, not the models.

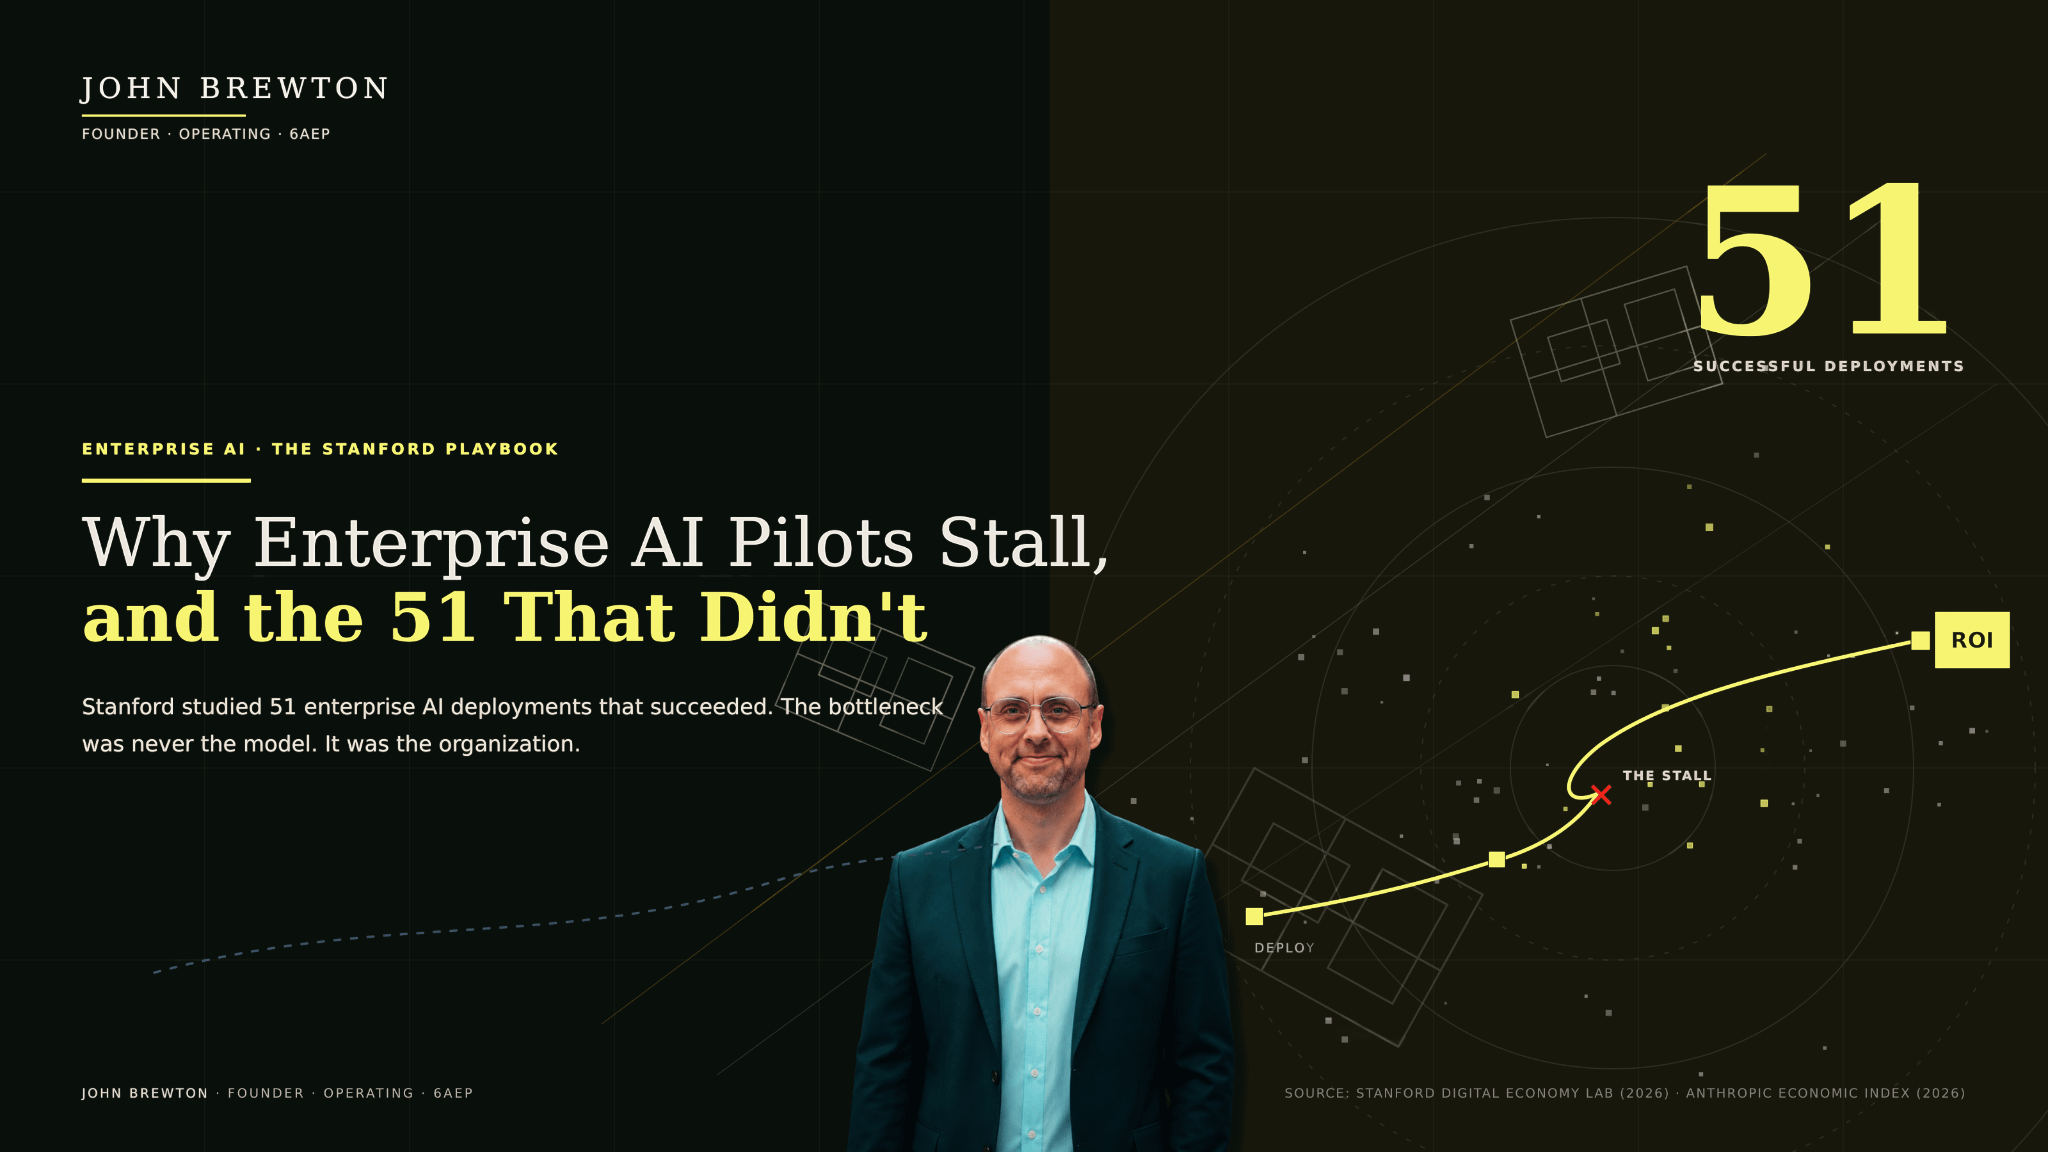
The operator’s path is rarely a straight line. It crosses open ground, stalls at a failure point, then recovers to deliver a tangible return on investment, hopefully. The route from deployed to value is an organizational journey, and the 51 companies examined in the Stanford study, analyzed in this piece, reached the end by managing the organizational and human path, not by buying a better model.
Too Long → Didn’t Read
Most enterprise AI pilots stall for organizational reasons, not technical ones. A 2025 MIT NANDA study found 95% of generative AI pilots produce no measurable financial impact. The Stanford Digital Economy Lab went the other way and documented 51 successful deployments. The model was never the differentiator. The organization was. This piece walks through where the real work sits and where to spend the next dollar of AI budget. It is about a six-minute read.
What you will find below:
Why do most enterprise AI pilots fail?
The 95% versus the 51, and why the model is not the variable.
What is the hardest part of deploying enterprise AI?
77% of the hardest work is invisible, and 61% of winners failed first.
Why do similar AI projects take weeks at one company and years at another?
The accelerators and the drags, none of them technical.
What does effective executive sponsorship of AI involve?
Clearing blockers, permitting failure, and managing staff-function resistance.
Does experience with AI compound over time?
The data says yes, and the gap is widening.
Does enterprise AI reduce headcount, and where should AI budget go?
Reduction is a choice, not a verdict.
Frequently asked questions and a full appendix with sources and downloads.
Two companion research reports are free to download: Inside 51 Successful AI Deployments and The Learning Curve.
Are you new to Operating?
You might enjoy these recent reader favorites:
Why do most enterprise AI pilots fail?
Most coverage of enterprise AI starts with the failures. MIT’s NANDA initiative found that 95% of generative AI pilots produce no measurable financial impact. Stanford’s Digital Economy Lab ran the experiment in reverse. Elisa Pereira, Alvin Wang Graylin, and Erik Brynjolfsson documented 51 deployments that delivered real value, drawn from 41 organizations across 9 industries, 7 countries, and 5 regions, covering more than one million workers. Then they asked what those organizations did differently (Figure 2).
Figure 2 · The failure rate and the exceptions
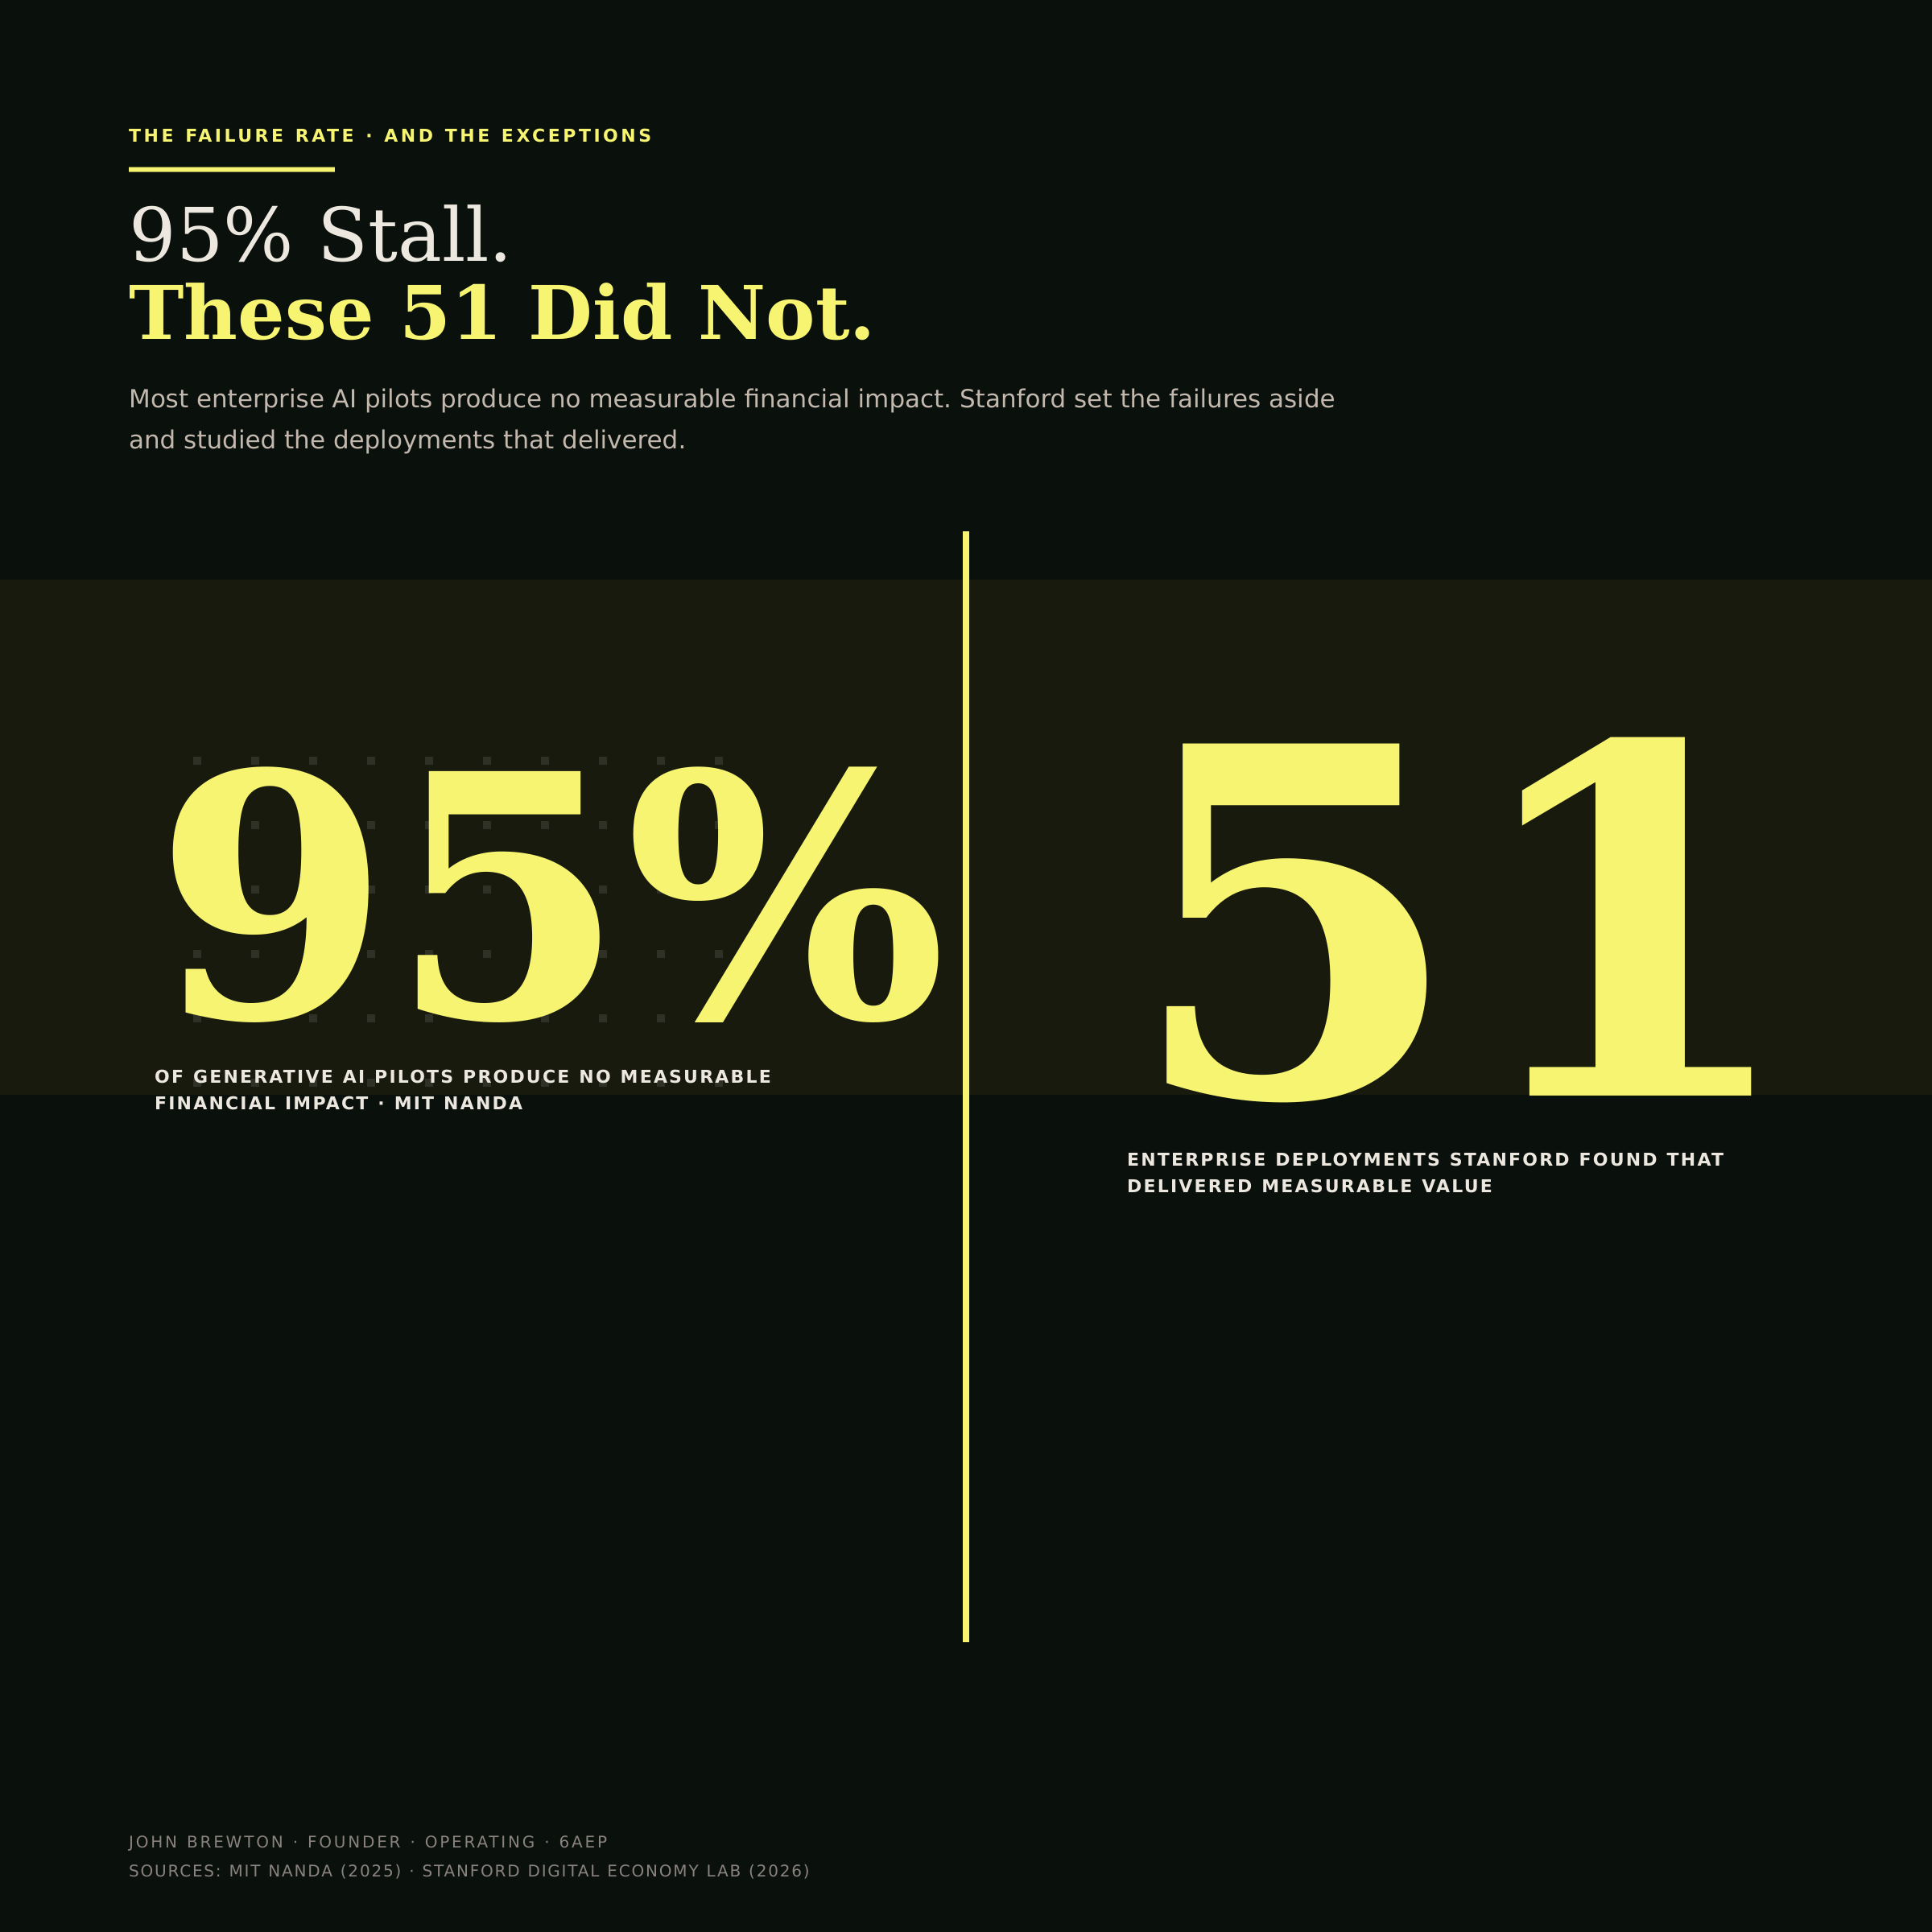
Two numbers set the stakes. 95% is the failure rate from the MIT study. 51 is the count of deployments Stanford chose to study precisely because they worked.
The answer aligns across all 11 chapters of their report. The model was never the differentiator. The organization was. The technology is the easy, increasingly commoditized part. The hard, durable, value-creating work is organizational. It is human. What great news for all us humans. The bottleneck is the org, not the technology. Both studies, from opposite directions, reach the same conclusion: AI fails at the org level, not the model.
What is the hardest part of deploying enterprise AI?
When practitioners were asked to name the hardest challenges, they did not mention technology. They named change management, data quality, and process redesign. Those intangible costs accounted for 77% of the hardest work. Teams described the technology itself as the easiest piece of the build (Figure 3).
Figure 3 · The invisible 77%
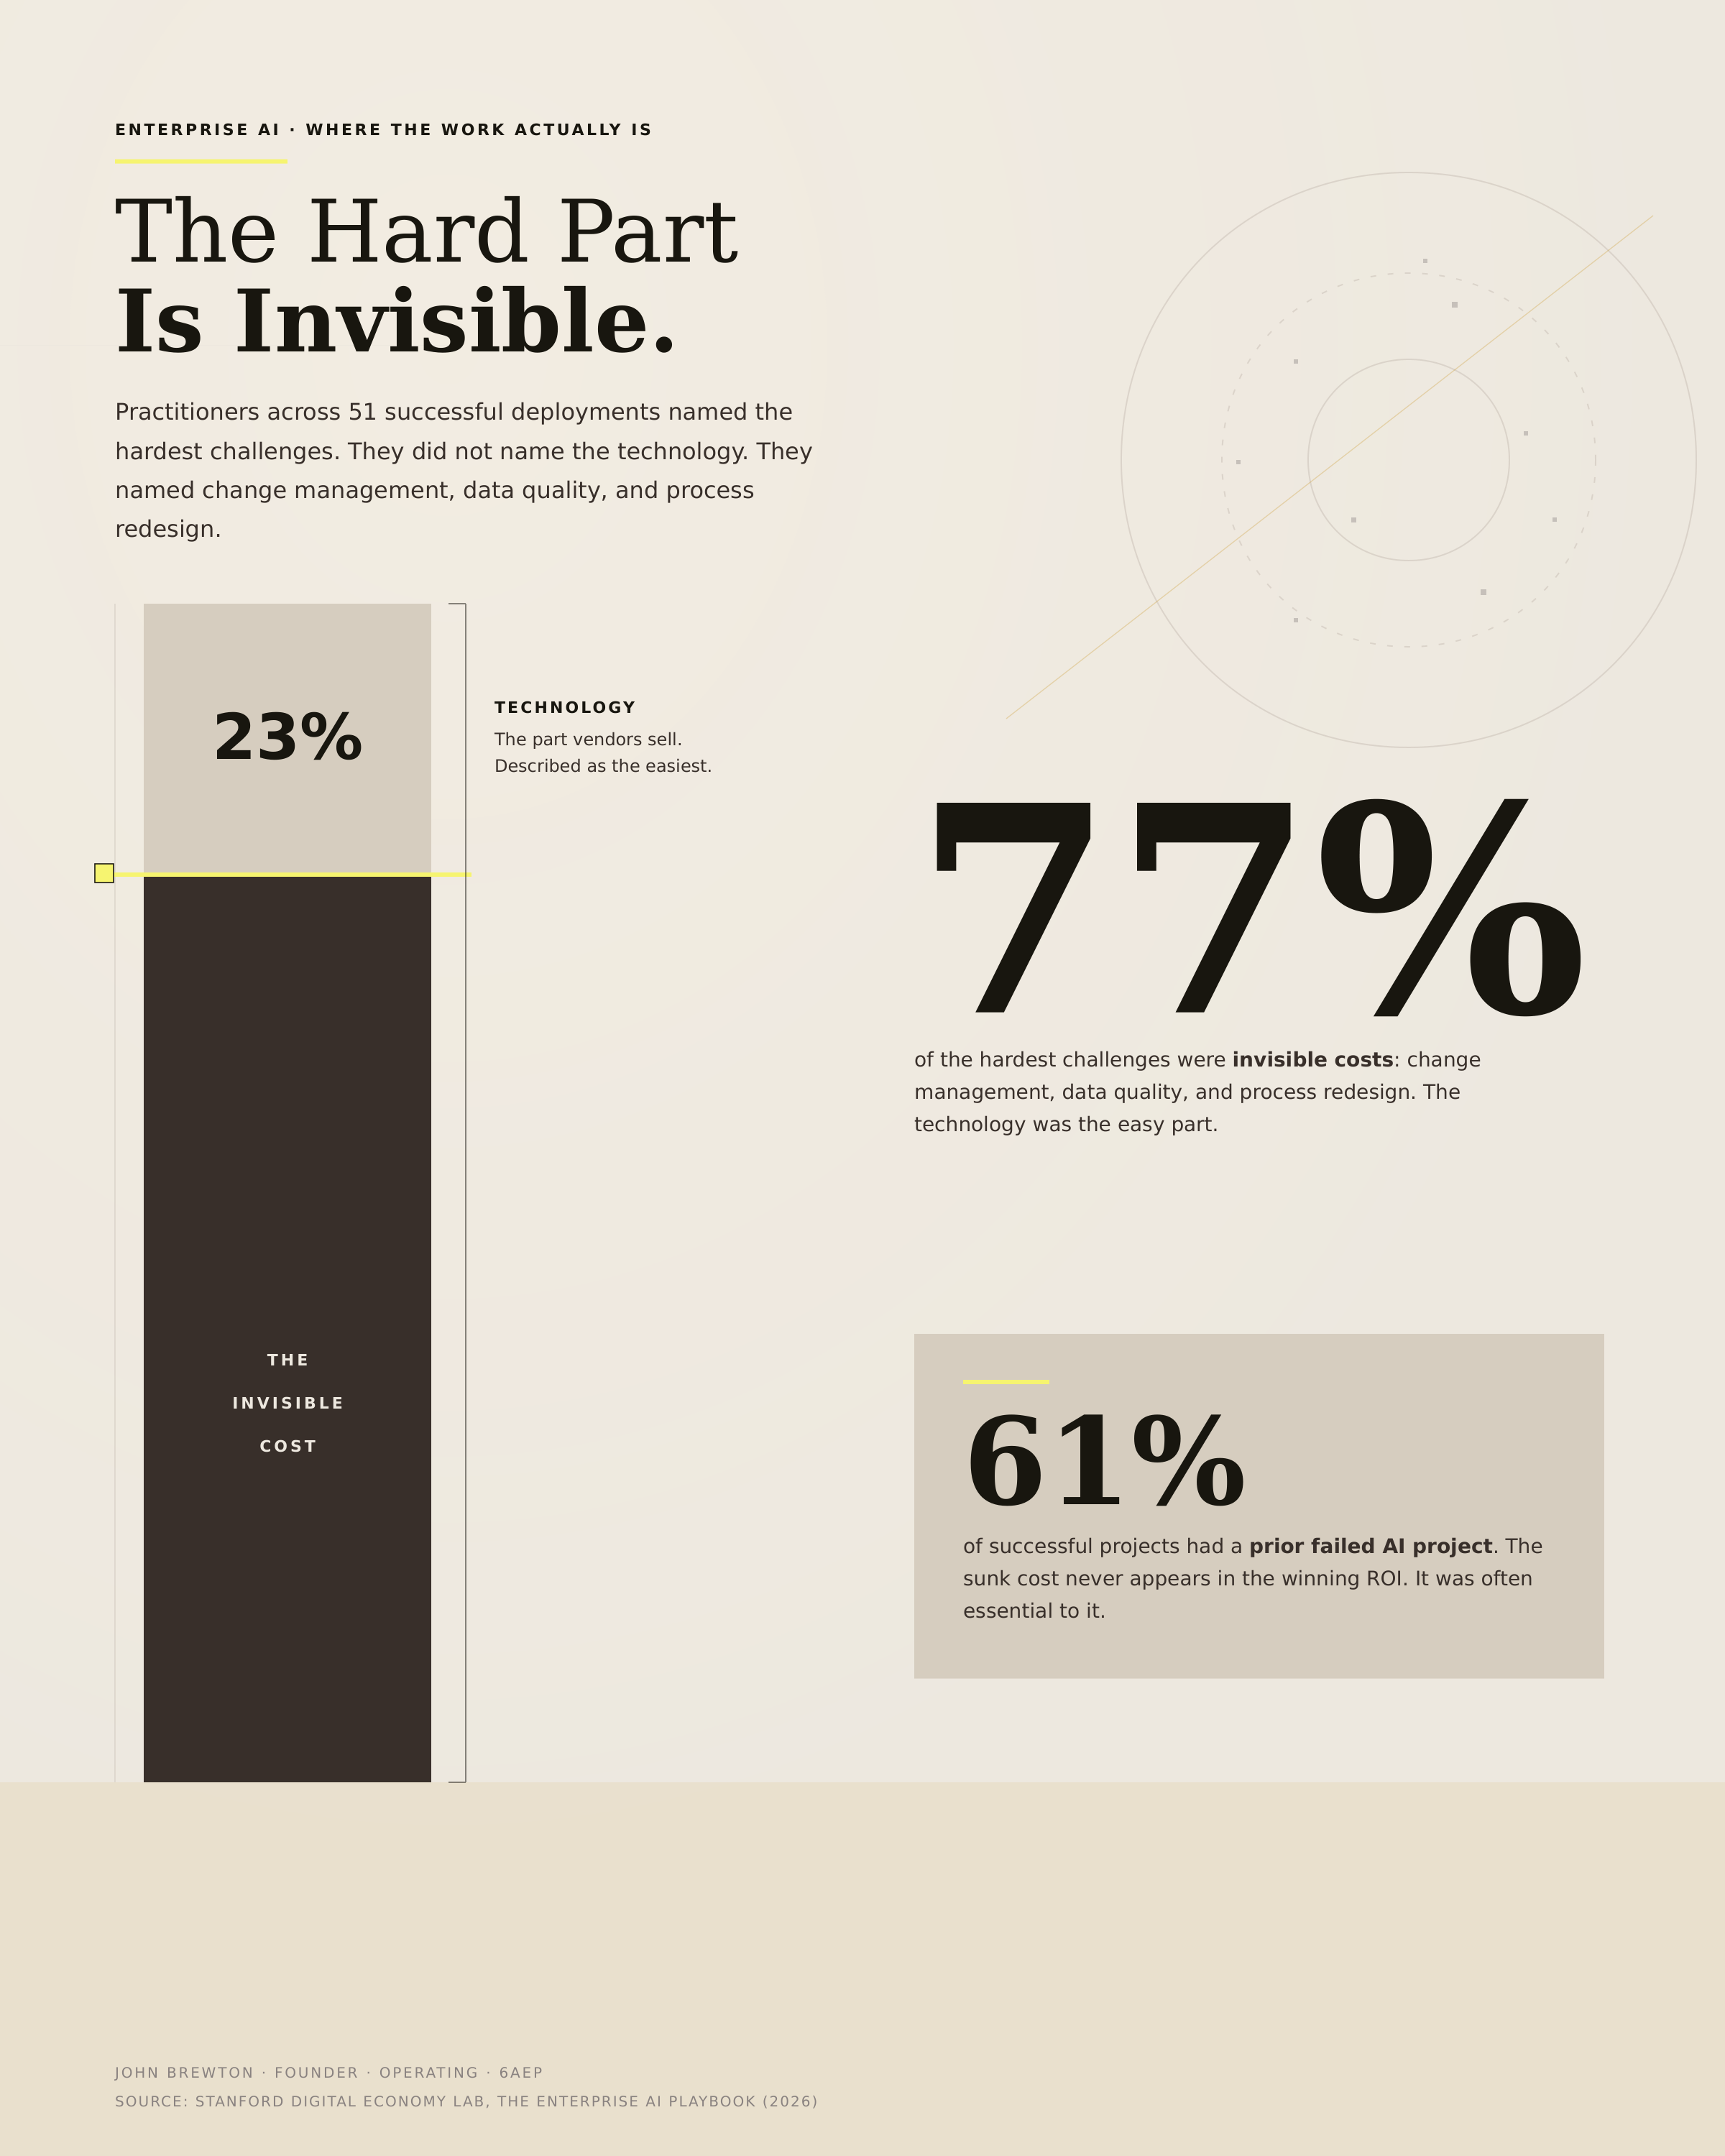
The visible 23% is the technology, the part a business case usually budgets for. The 77% below the line is change management, data quality, and process redesign, the work that decides the outcome and rarely makes the spreadsheet. The yellow rule marks the waterline between what leaders see and what actually costs them.
The cost of the business case missed is the failure that came first. 61% of successful projects had a prior failed AI project. That sunk cost never appears in the winning project’s ROI, yet it was often essential to the win. First attempts failed for consistent reasons. Teams pointed AI at broken workflows. Technical groups were led without business ownership. Leaders assumed the model would fix problems that required redesigning the work.
The data backs a counterintuitive point about readiness. Only 6% of deployments had data fully ready for AI, yet 91% processed unstructured data and 88% made previously inaccessible data usable (Figure 4).
Figure 4 · The data-readiness paradox
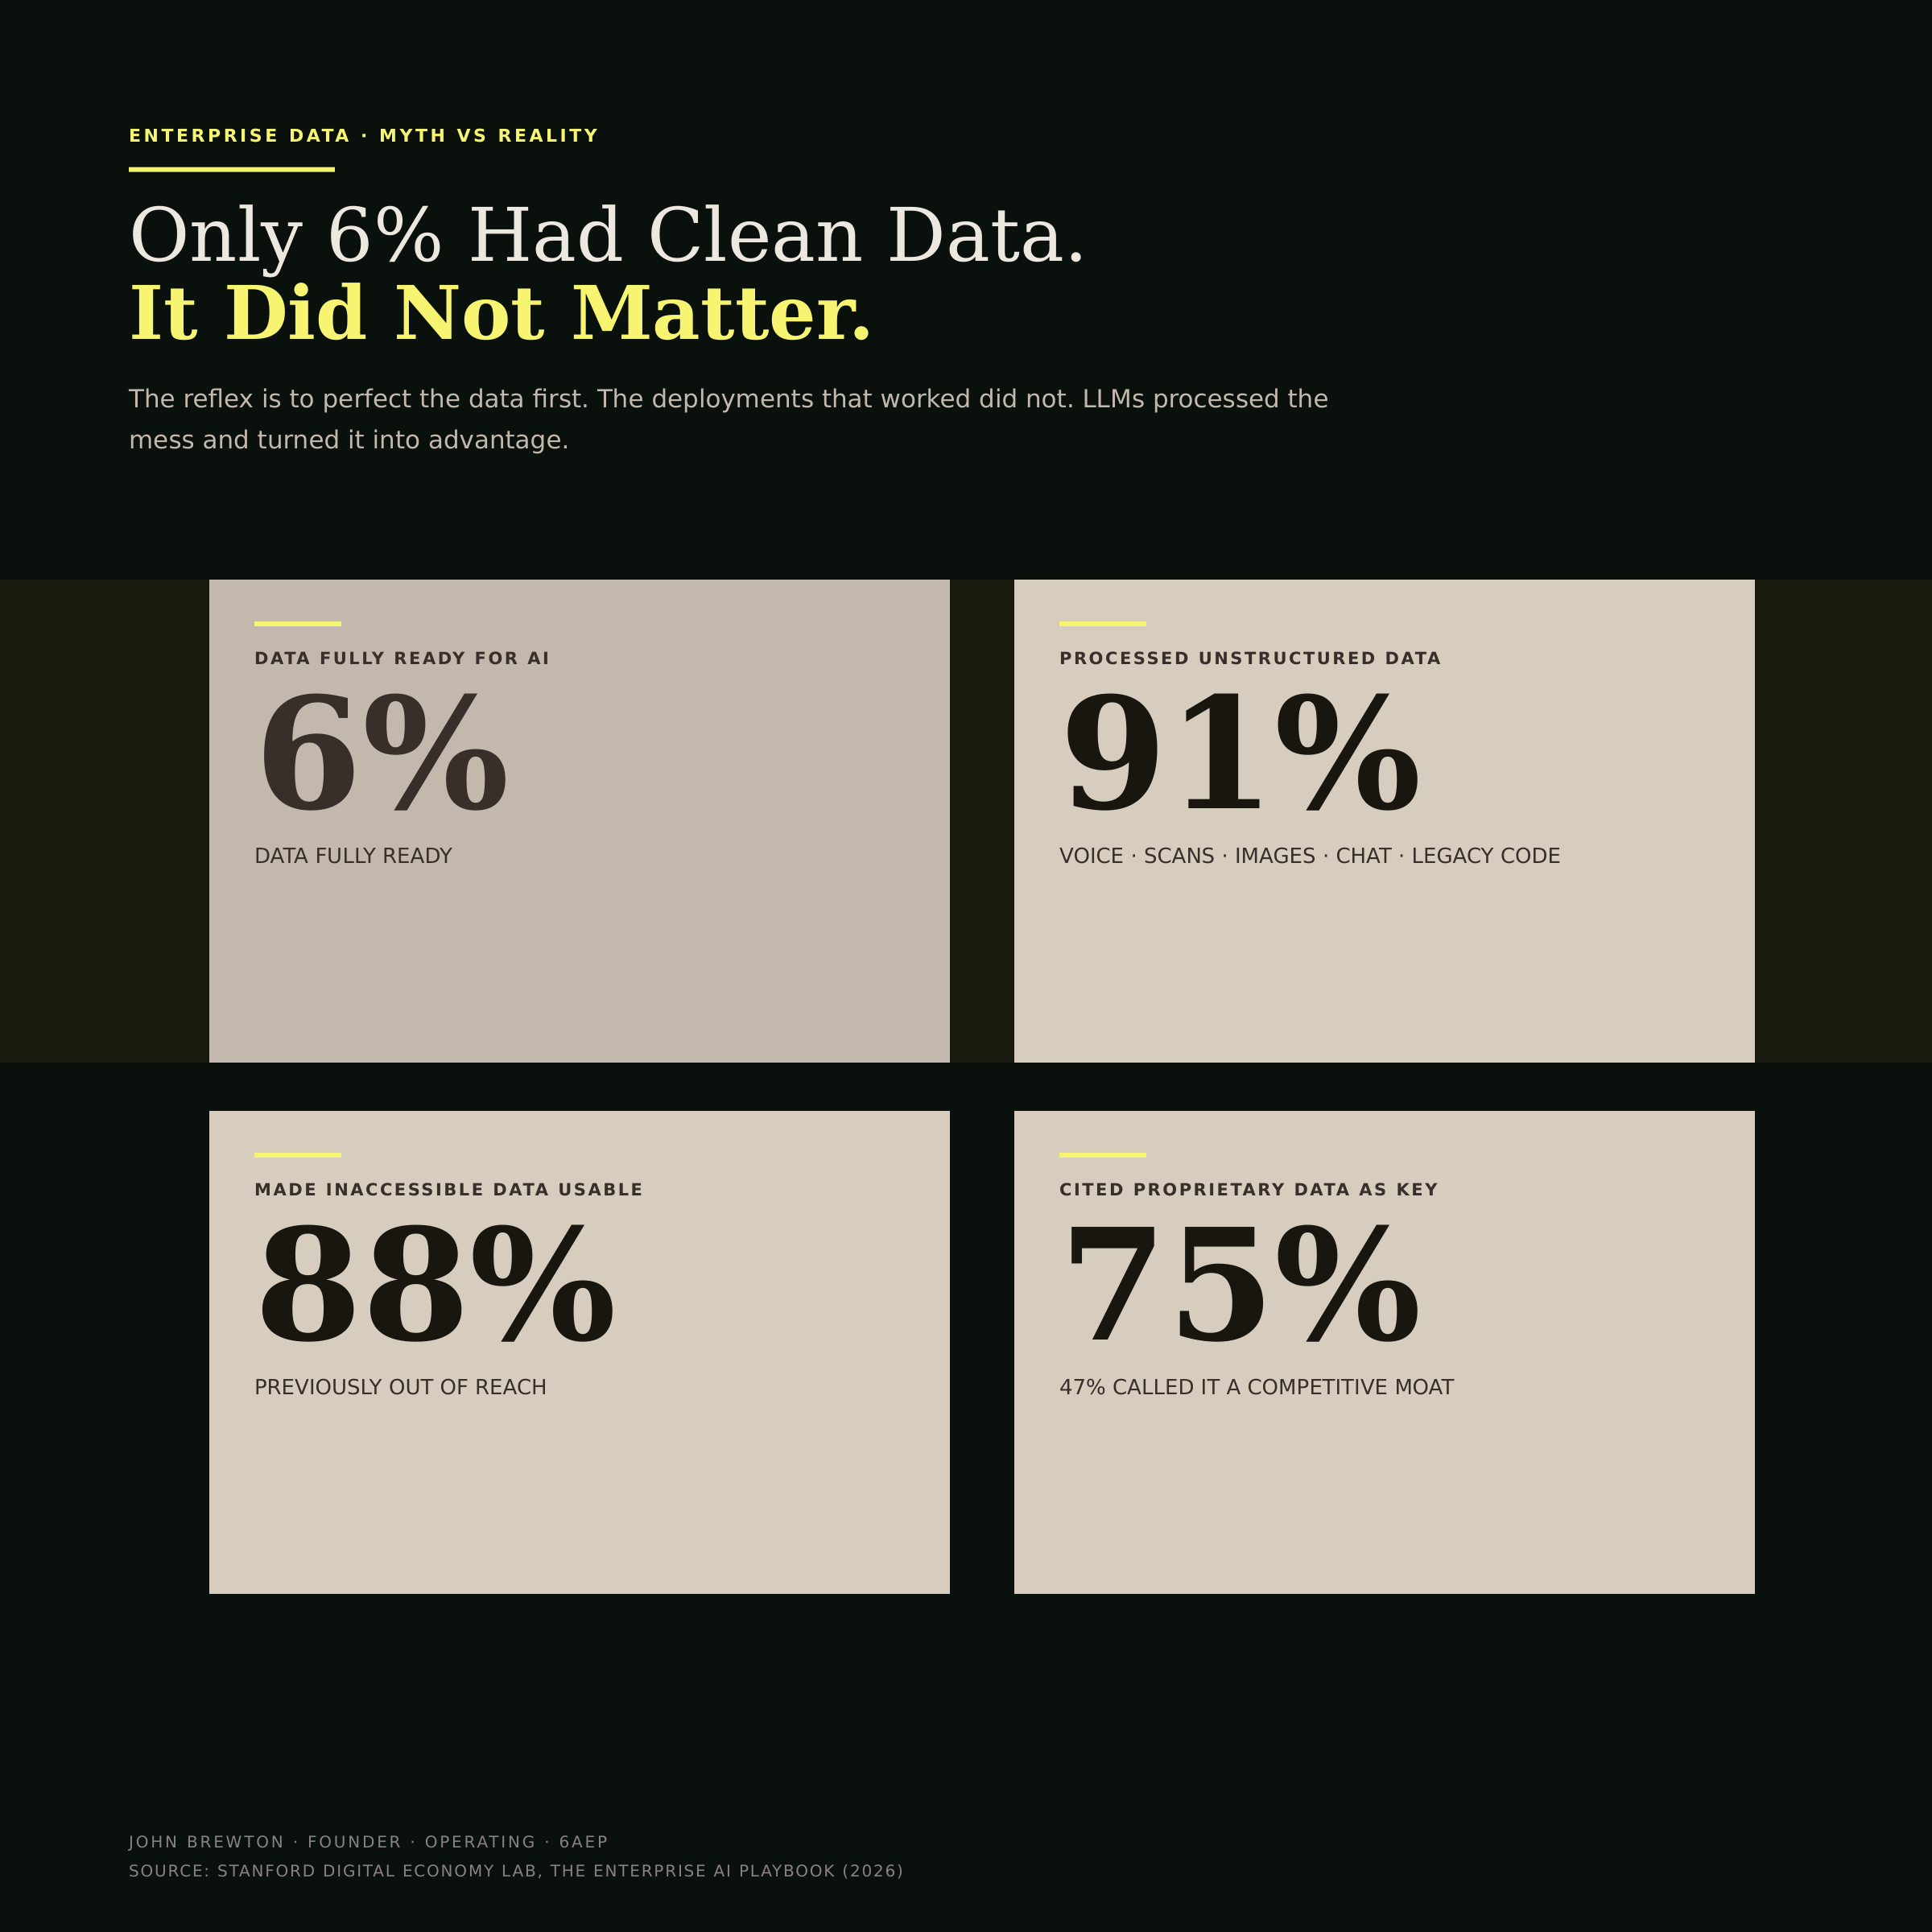
The “perfect the data first” instinct is the one this panel dismantles. Only 6% of these teams had ready data, and they shipped anyway. The lesson on the right is the durable one: messy proprietary data you own beats clean data anyone can buy. The operator’s move is to budget for the invisible 77% and to treat the first failure as tuition rather than waste.
Why do similar AI projects take weeks at one company and years at another?
The cleanest proof of the thesis is timing. A fintech migrated millions of lines of legacy code in weeks. A major bank attempting a comparable customer support build reports timelines measured in years. Same technology. Same category of use case. Different organizations, and an outcome gap of more than an order of magnitude (Figure 5).
Figure 5 · Same use case, weeks or years
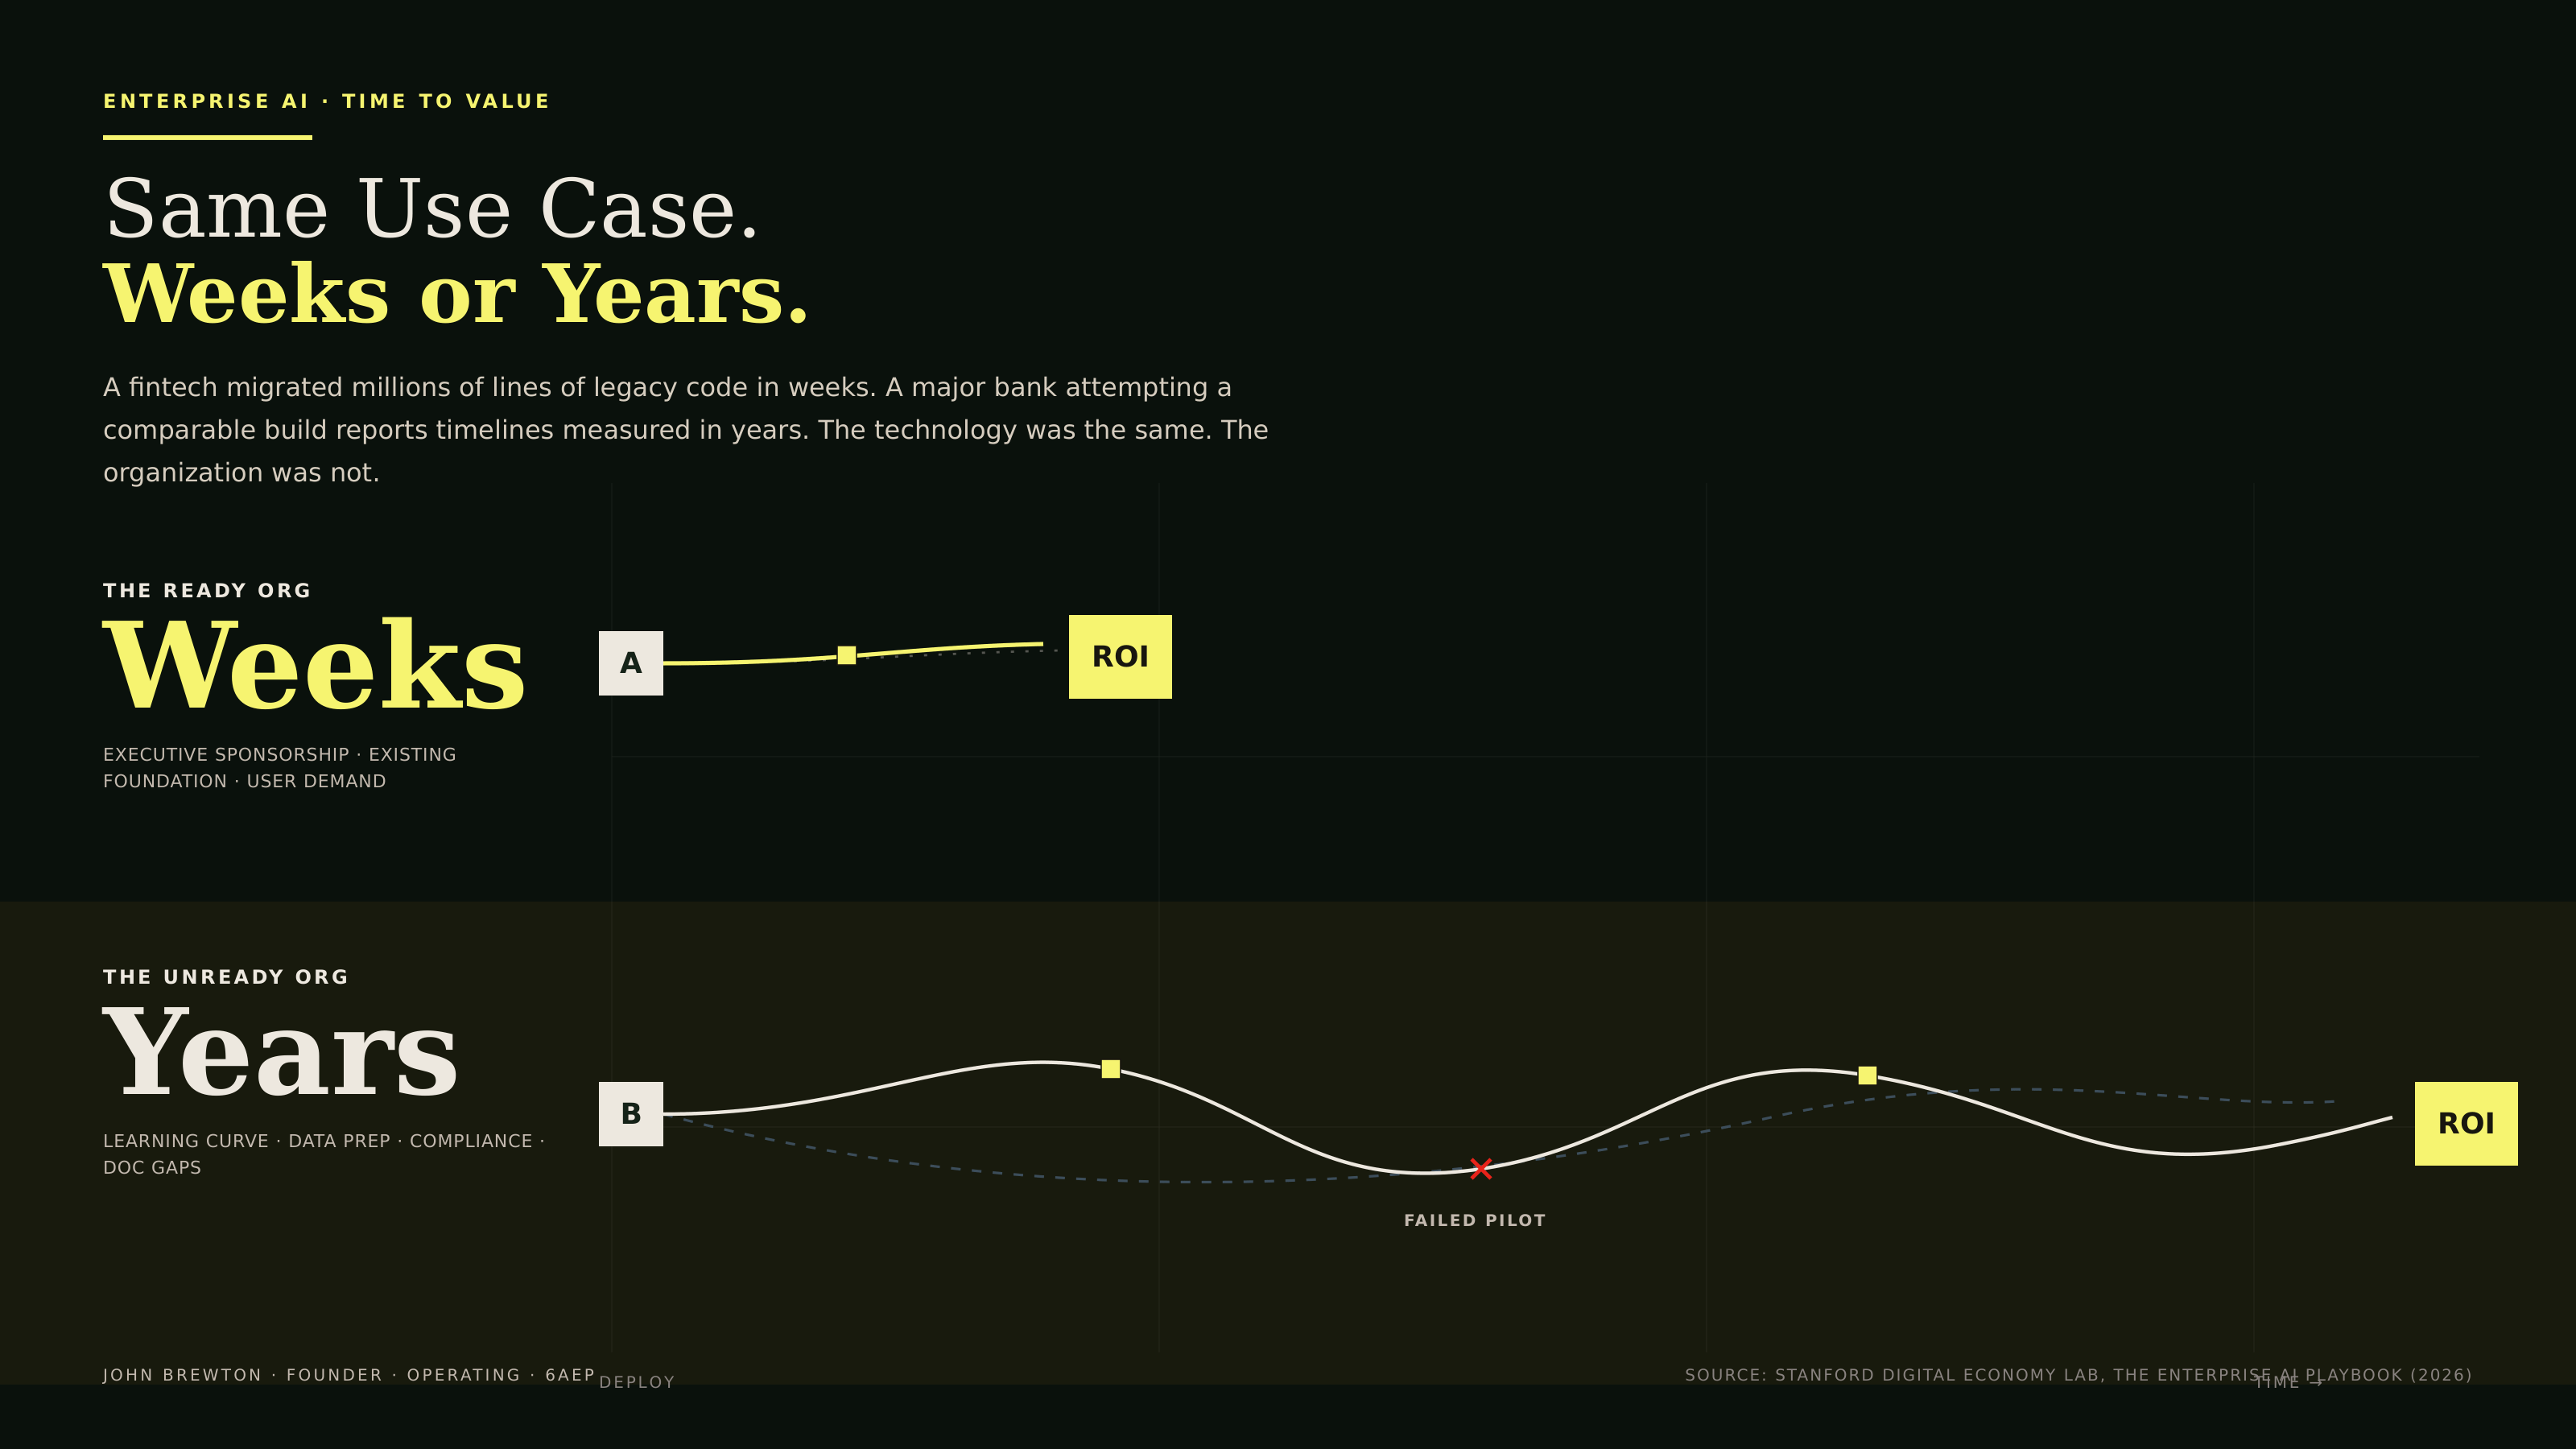
Two tracks, one technology. The top path is short and direct because the organization was ready. The bottom path winds across the whole frame, detours through a failed pilot, and arrives years later. The visual makes the point a table cannot: the distance between the two is organizational readiness, nothing else.
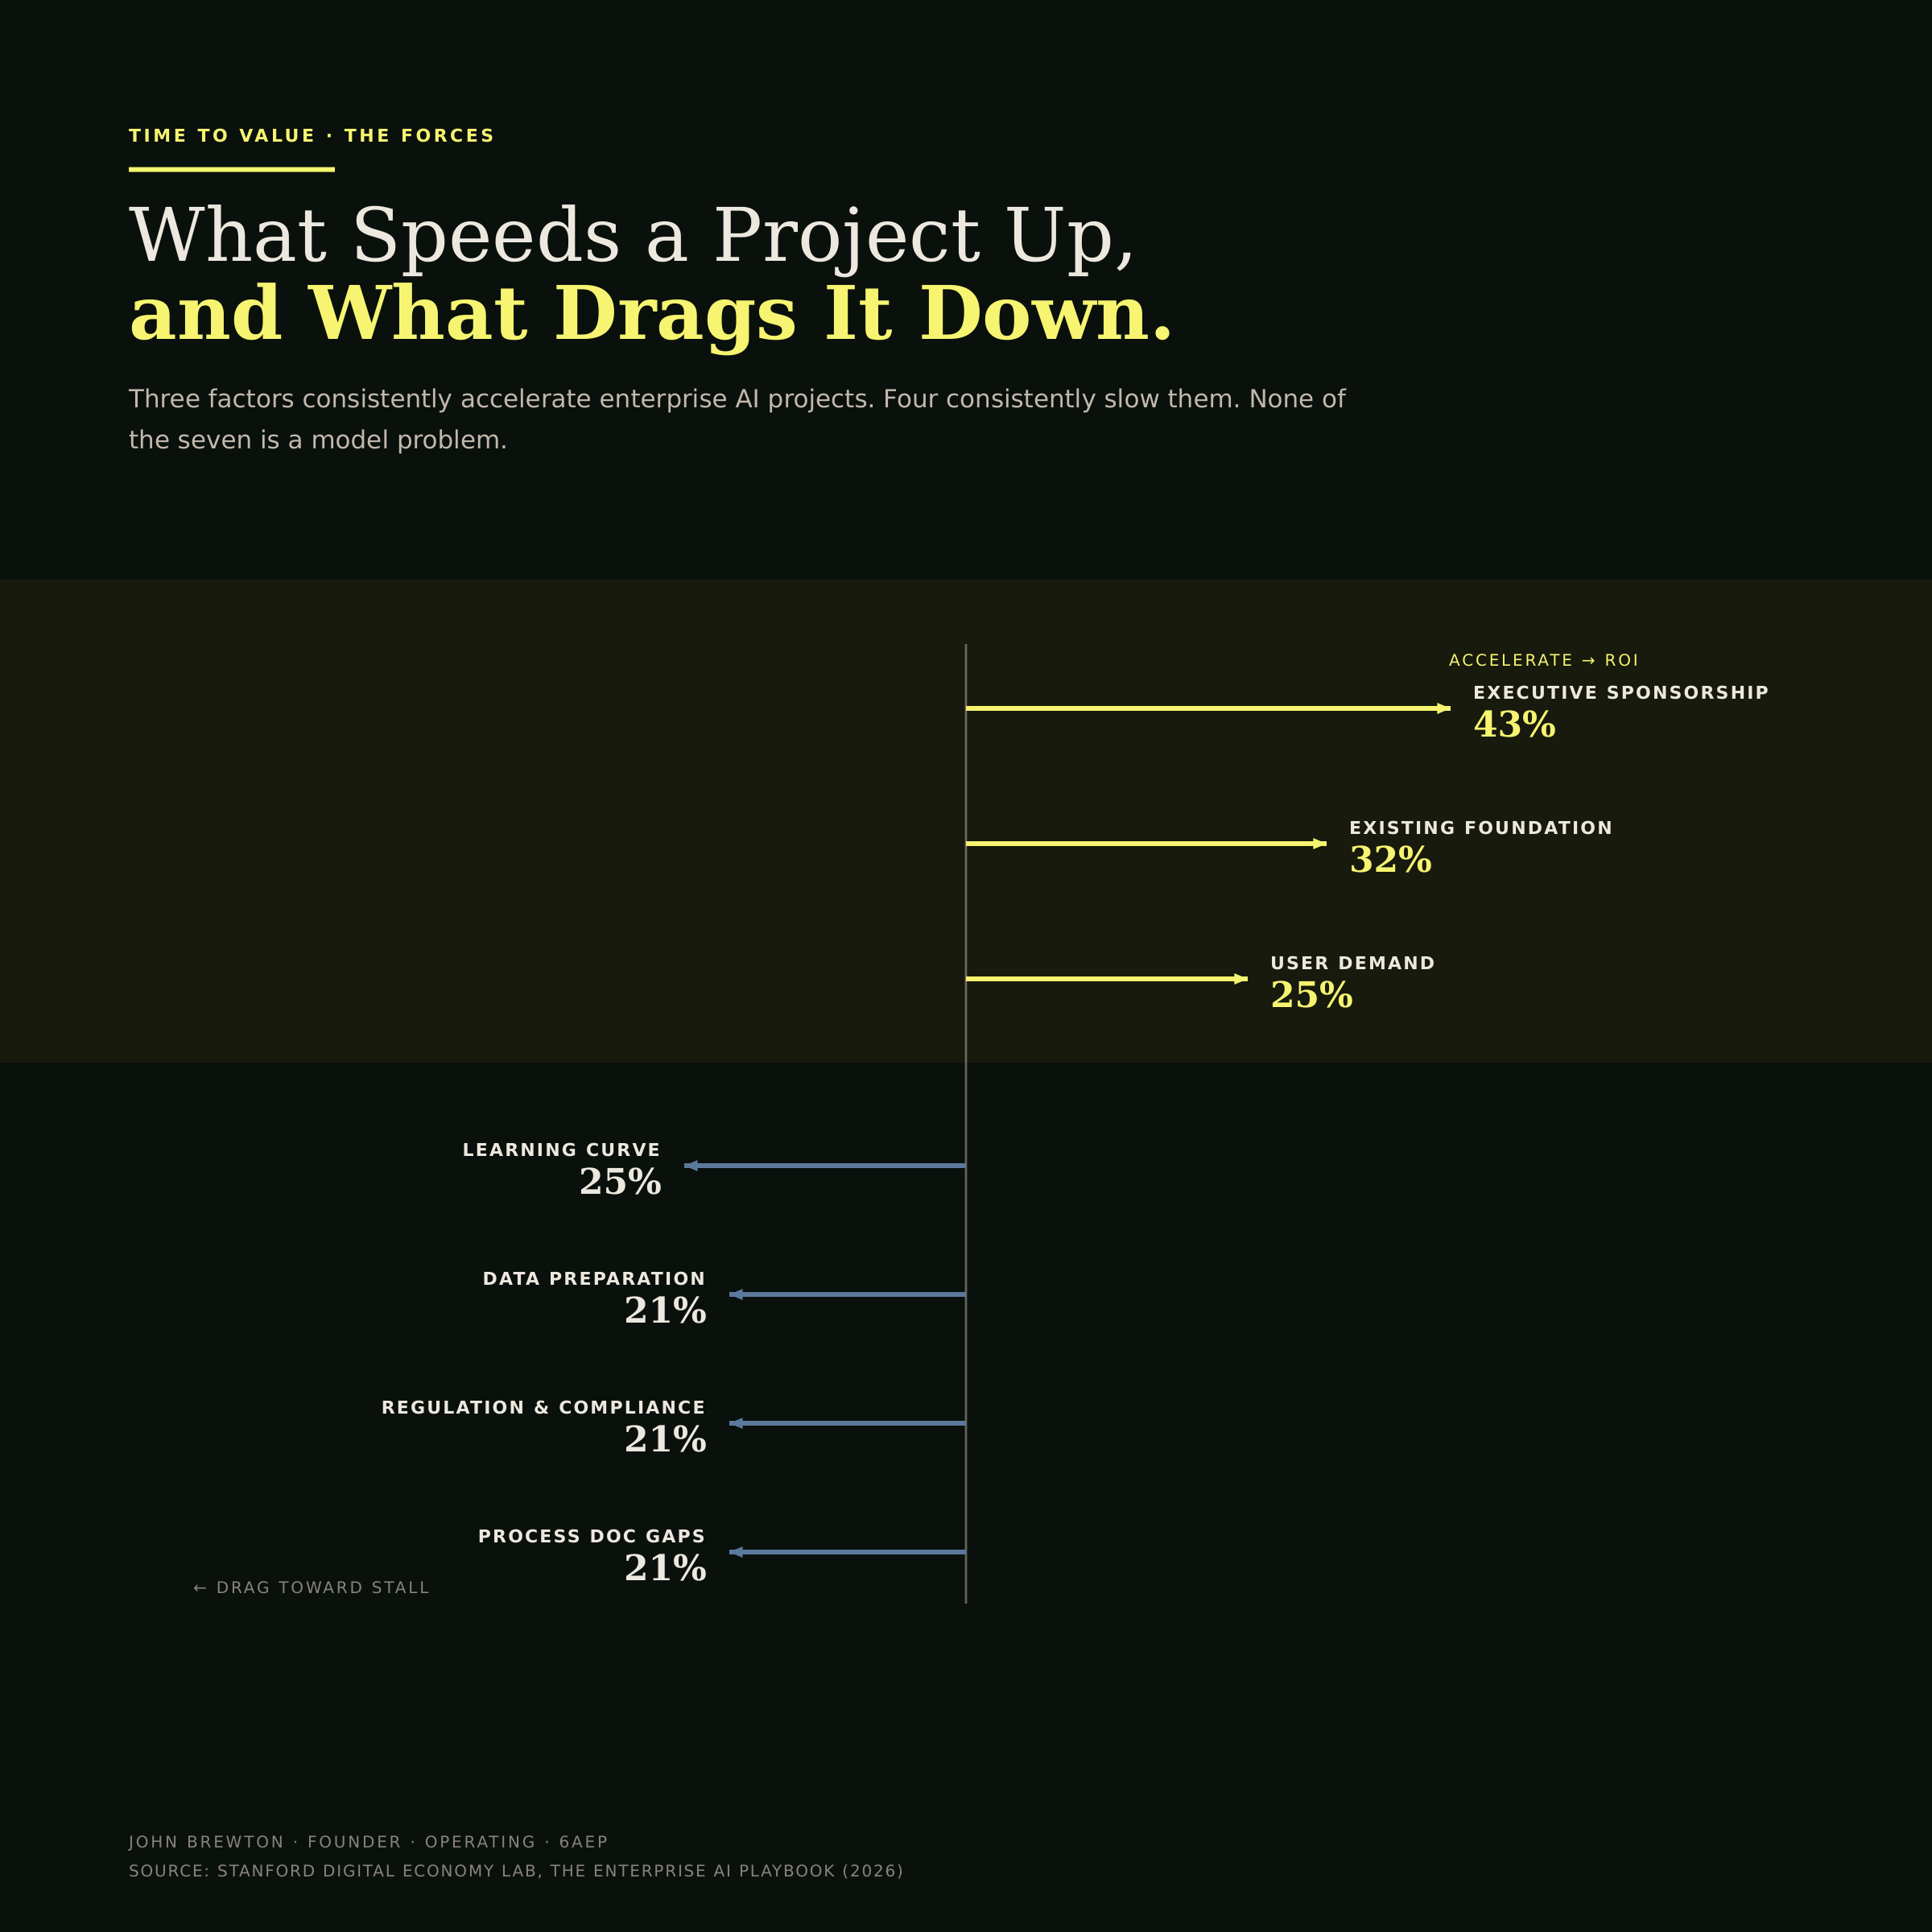
Three factors consistently accelerated time to value: executive sponsorship in 43% of cases, building on an existing foundation in 32%, and genuine end-user demand in 25%. Four factors consistently slowed projects down, each in roughly a fifth of cases: the learning curve and iteration, data quality and preparation, regulatory and compliance work, and gaps in process documentation. None of those four is a model problem. All four are organizational (Figure 6).
Figure 6 · The forces on time to value

A tug-of-war on a single axis. The yellow vectors pull a project toward ROI, the counter-vectors pull it back toward the stall. Read the labels and the editorial point is unmistakable: every force on both sides is a choice about people and process, not a property of the model.
One pattern was absolute. Every successful project with an identifiable methodology used iteration. None used waterfall. The shape of the work was always start small, learn, expand.
What does effective executive sponsorship of AI involve?
The report draws a sharp line between sponsors who drive results and sponsors who approve budgets. On a four-point engagement scale, only 29% of cases reached Strategic Integration, the level at which AI adoption became a corporate OKR tied to incentives. The seven cases that achieved organization-wide change all reached that level. None reached it by writing a check (Figure 7).
Figure 7 · The sponsorship ascent
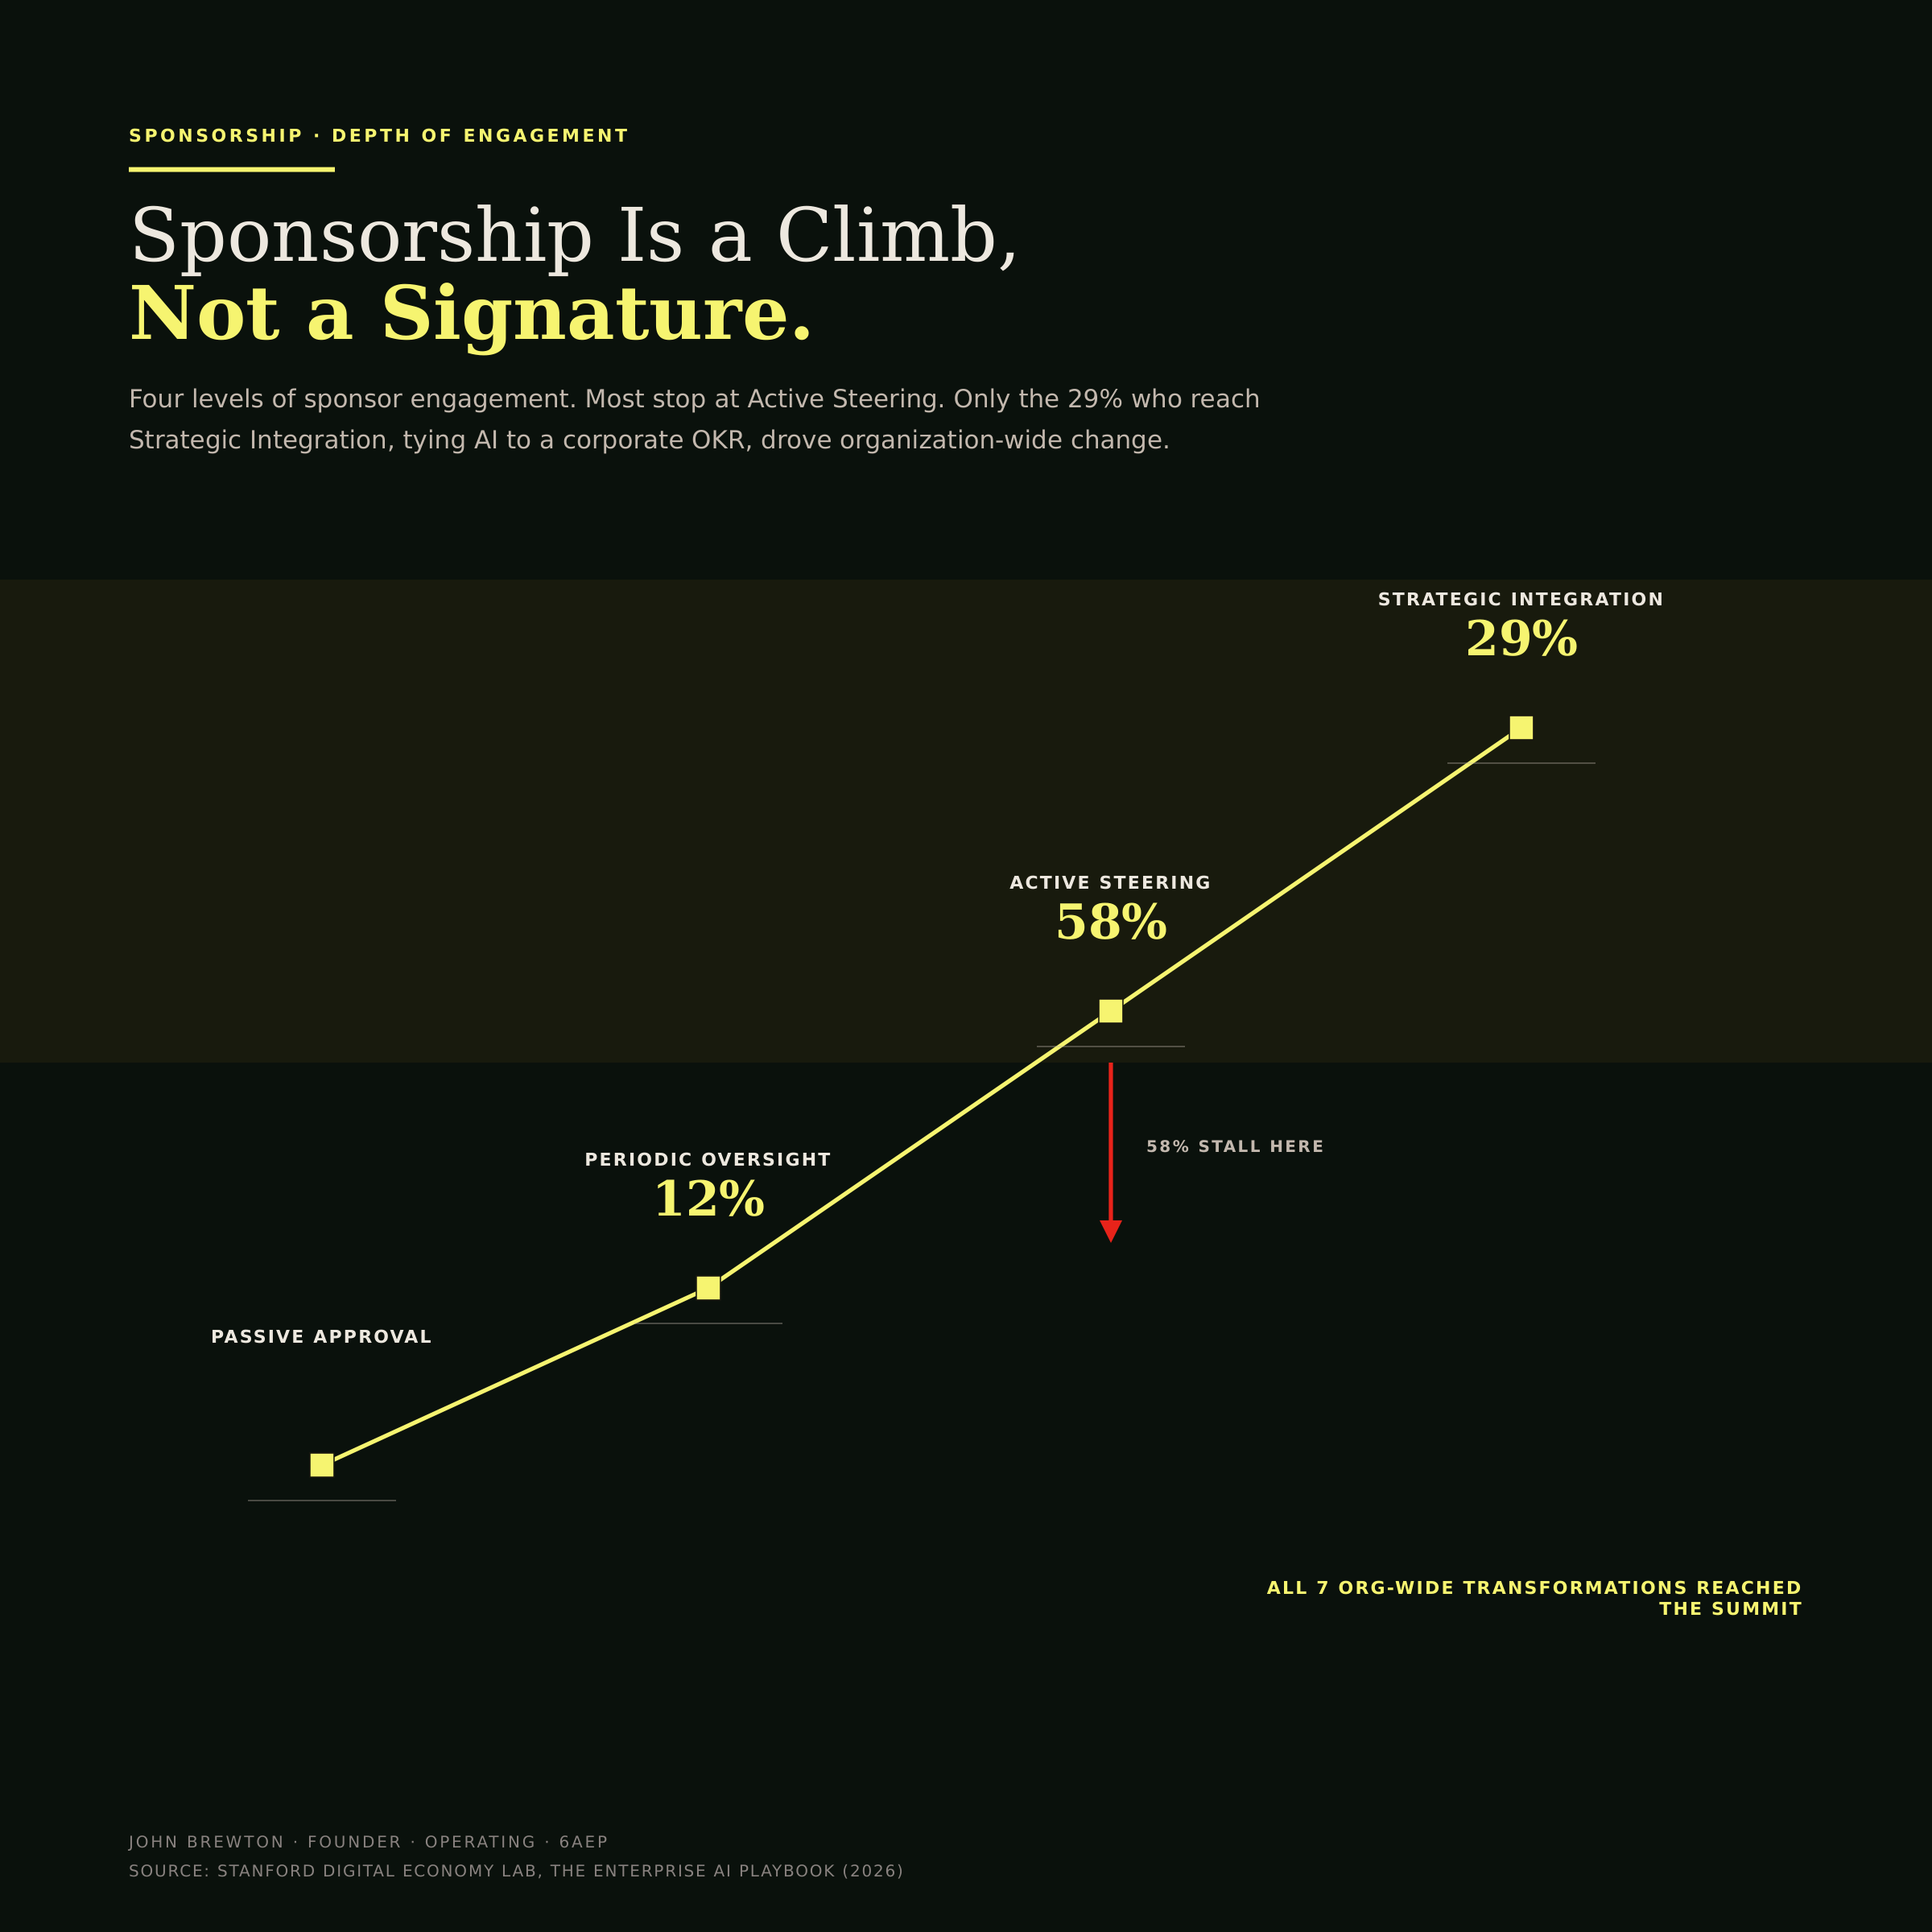
Sponsorship is drawn as a climb because that is what it is. Most leaders stop at Active Steering, the 58% rung. The summit, Strategic Integration, is where AI becomes a corporate objective tied to incentives, and it is the only rung where organization-wide change happened. The red mark shows where most stall out.
Effective sponsors do specific things. They clear blockers weekly. They bridge the business and technical teams. They give teams permission to fail, and they mean it. In no case studied was anyone punished for a failed AI initiative. 73% of teams started small on purpose, and 63% framed their pilots as experiments rather than launches.
Resistance came from a place most leaders do not expect. Staff functions, not frontline workers, were the most frequent source. Legal, HR, Risk, and Compliance accounted for 35% of resistance. Internal end-users accounted for 23%. Frontline fear of replacement appeared in only two cases. Staff functions have the authority to slow a project regardless of executive support, and they respond to governance rather than persuasion. Bring them in early with a mandate, and several of them will convert from blockers to enablers.
The same discipline shows up in the amount of human oversight each function needs. Escalation models, where AI handles the work and humans review exceptions, delivered the highest gains. Approval models fit regulated, high-stakes work. The right level depends on the task, not the technology (Figure 8).
Figure 8 · Oversight by function
One graphic carries six data points and a design principle. Functions sit in the oversight band that fits them, plotted by the productivity gain they delivered. The takeaway for an operator is to stop asking how much to trust AI in general and start matching the level of oversight to the task at hand.
Does experience with AI compound over time?
The Stanford data describes organizations. A second dataset describes individuals, and it points in the same direction. Anthropic’s Economic Index studied one million conversations and found that experience with AI is self-reinforcing (Figure 9).
Figure 9 · The advantage compounds
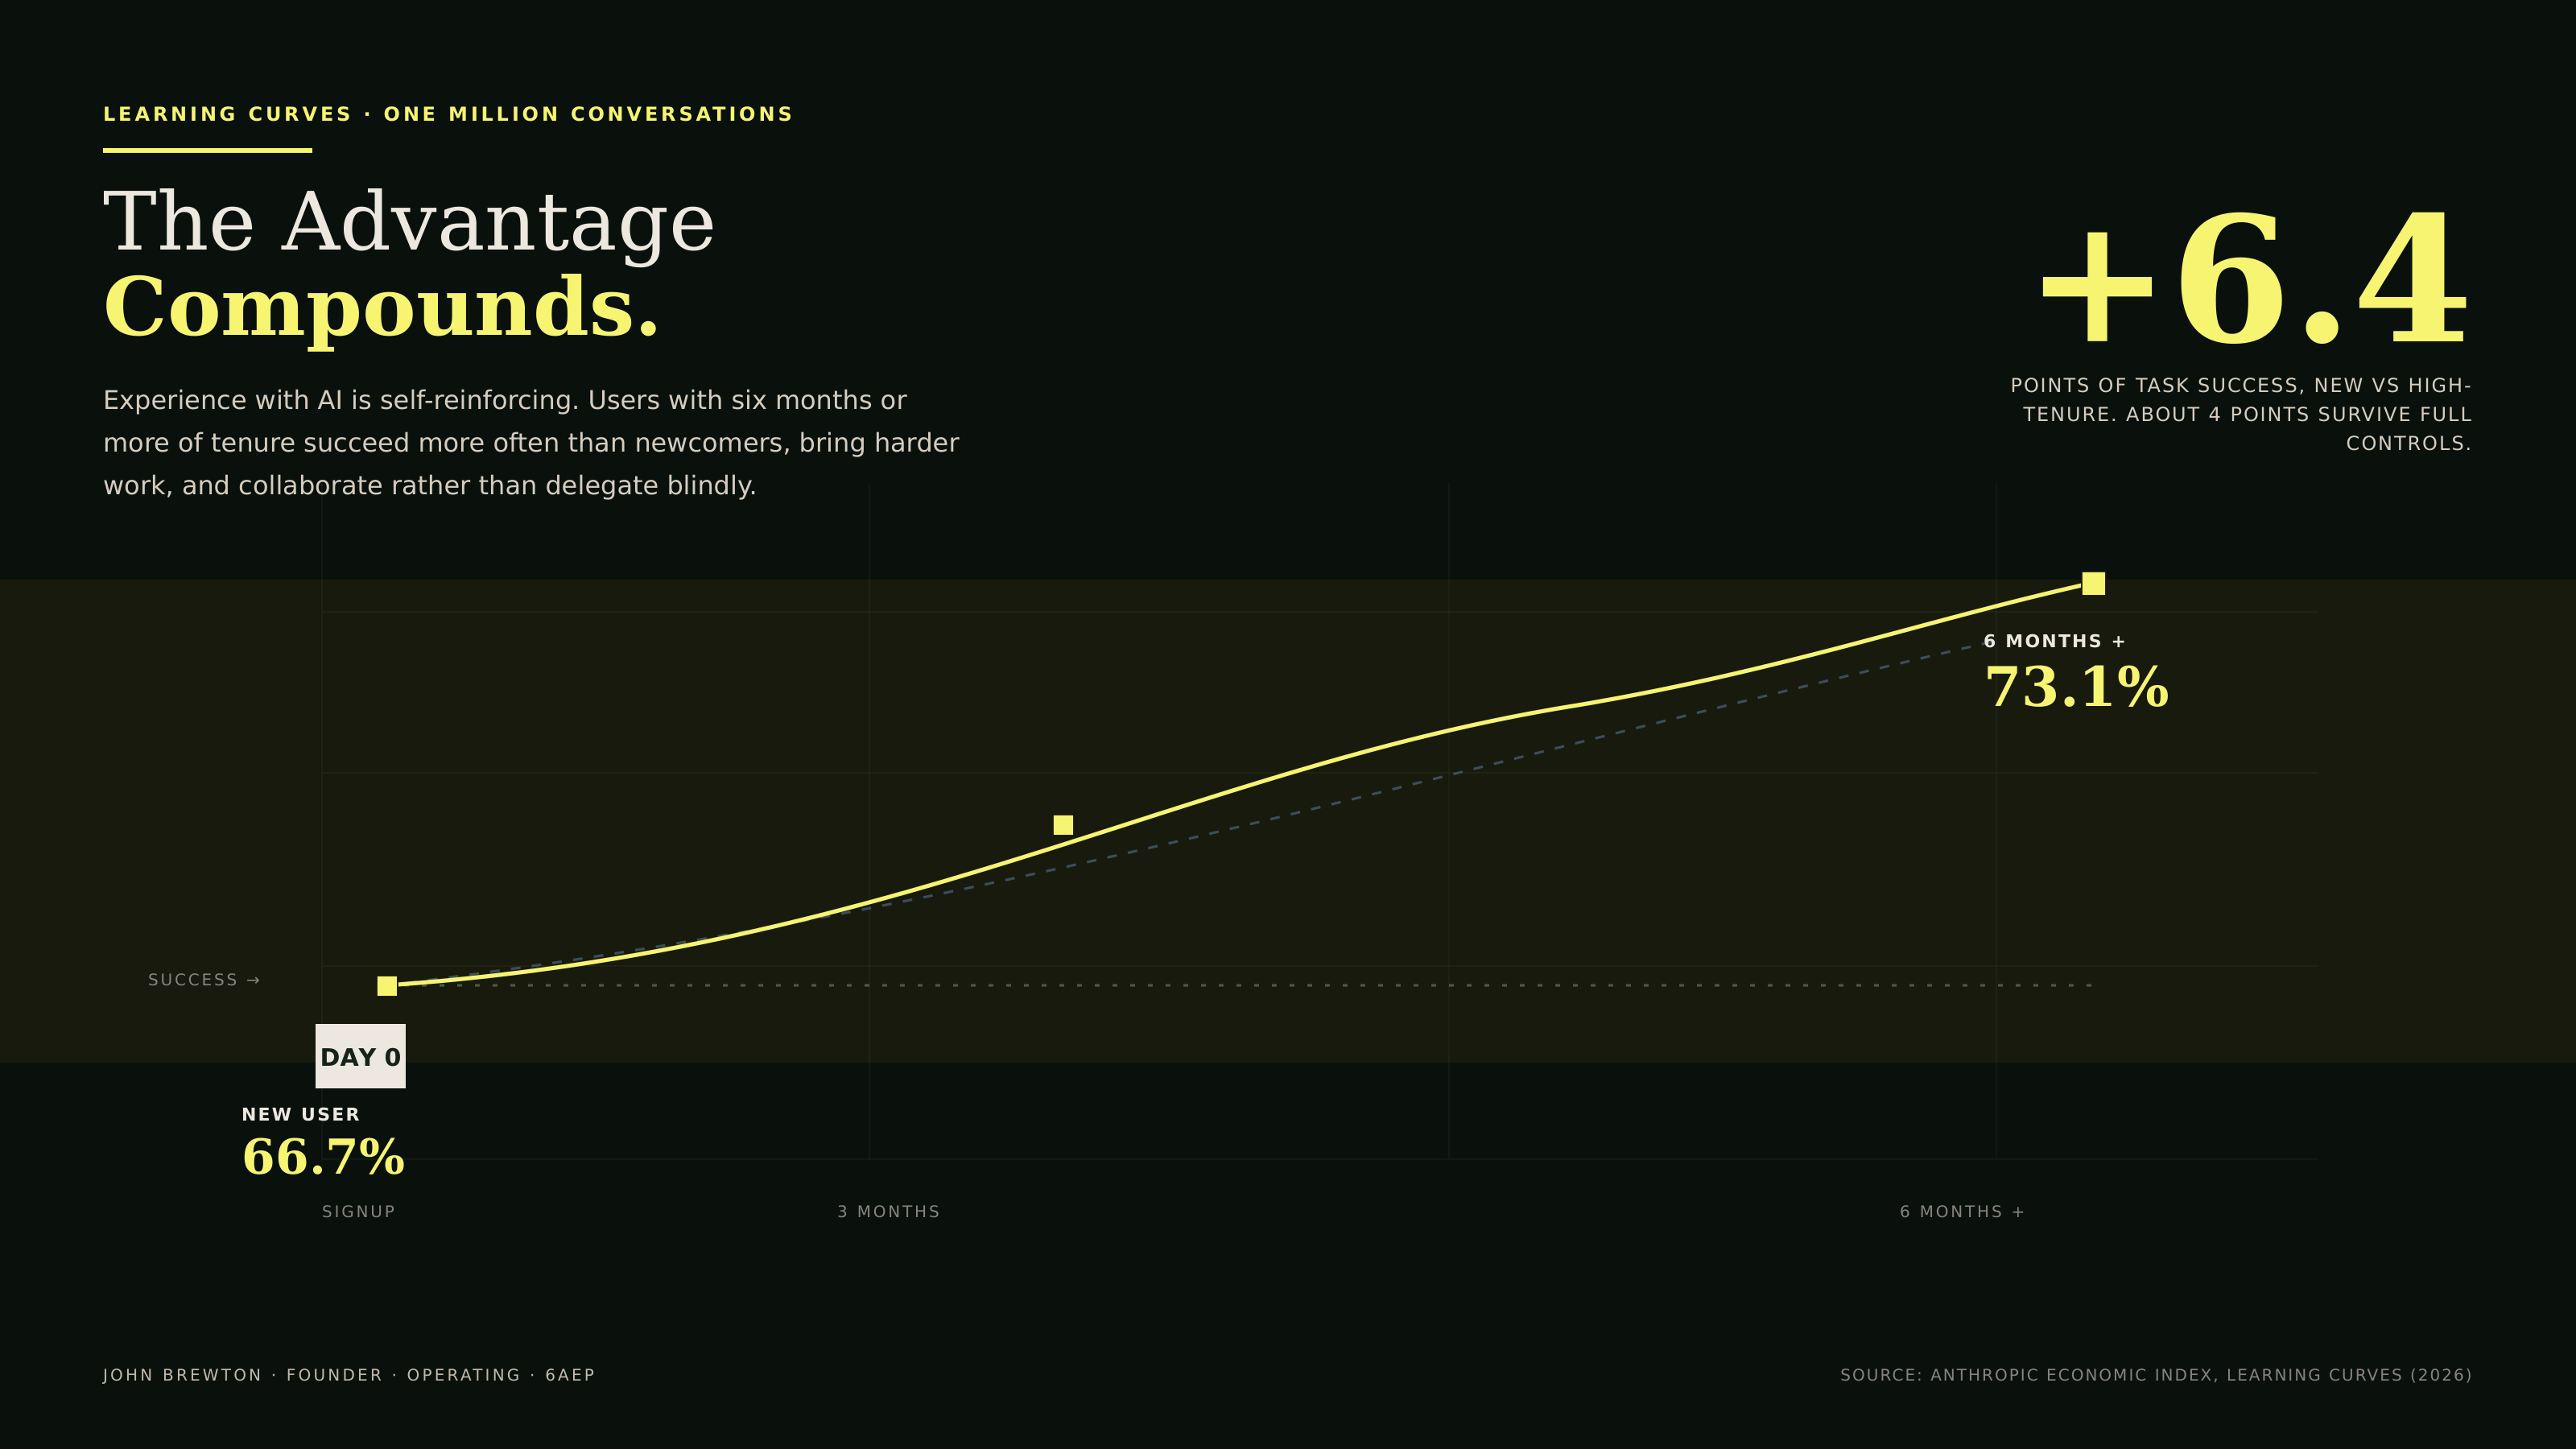
The curve climbs with tenure. Newcomers succeed about two-thirds of the time, seasoned users closer to three-quarters, and roughly four points of that gap survive every statistical control. The editorial reading is that skill with AI is earned through use, which means the advantage is cumulative and the latecomer cannot simply buy it.
Users with six or more months of tenure succeed more often than newer users. Their task success rate is 73.1%, compared with 66.7% for newer users. That edge survives strict controls. Comparing high-and-low-tenure users within the same narrowly defined task, and then adding controls for model, language, use case, and country, leaves a success gap of about 4 percentage points. The difference is not the task they pick. The difference is the skill they built through use.
Experienced users also calibrate. They send their hardest, most valuable work to the most capable model. For every additional $10 in hourly wage for a task, Opus's share increases by 1.5 points on Claude.ai and by 2.8 points on the API. Programmatic users calibrate roughly twice as hard as web users (Figure 10).
Figure 10 · Calibration by task value
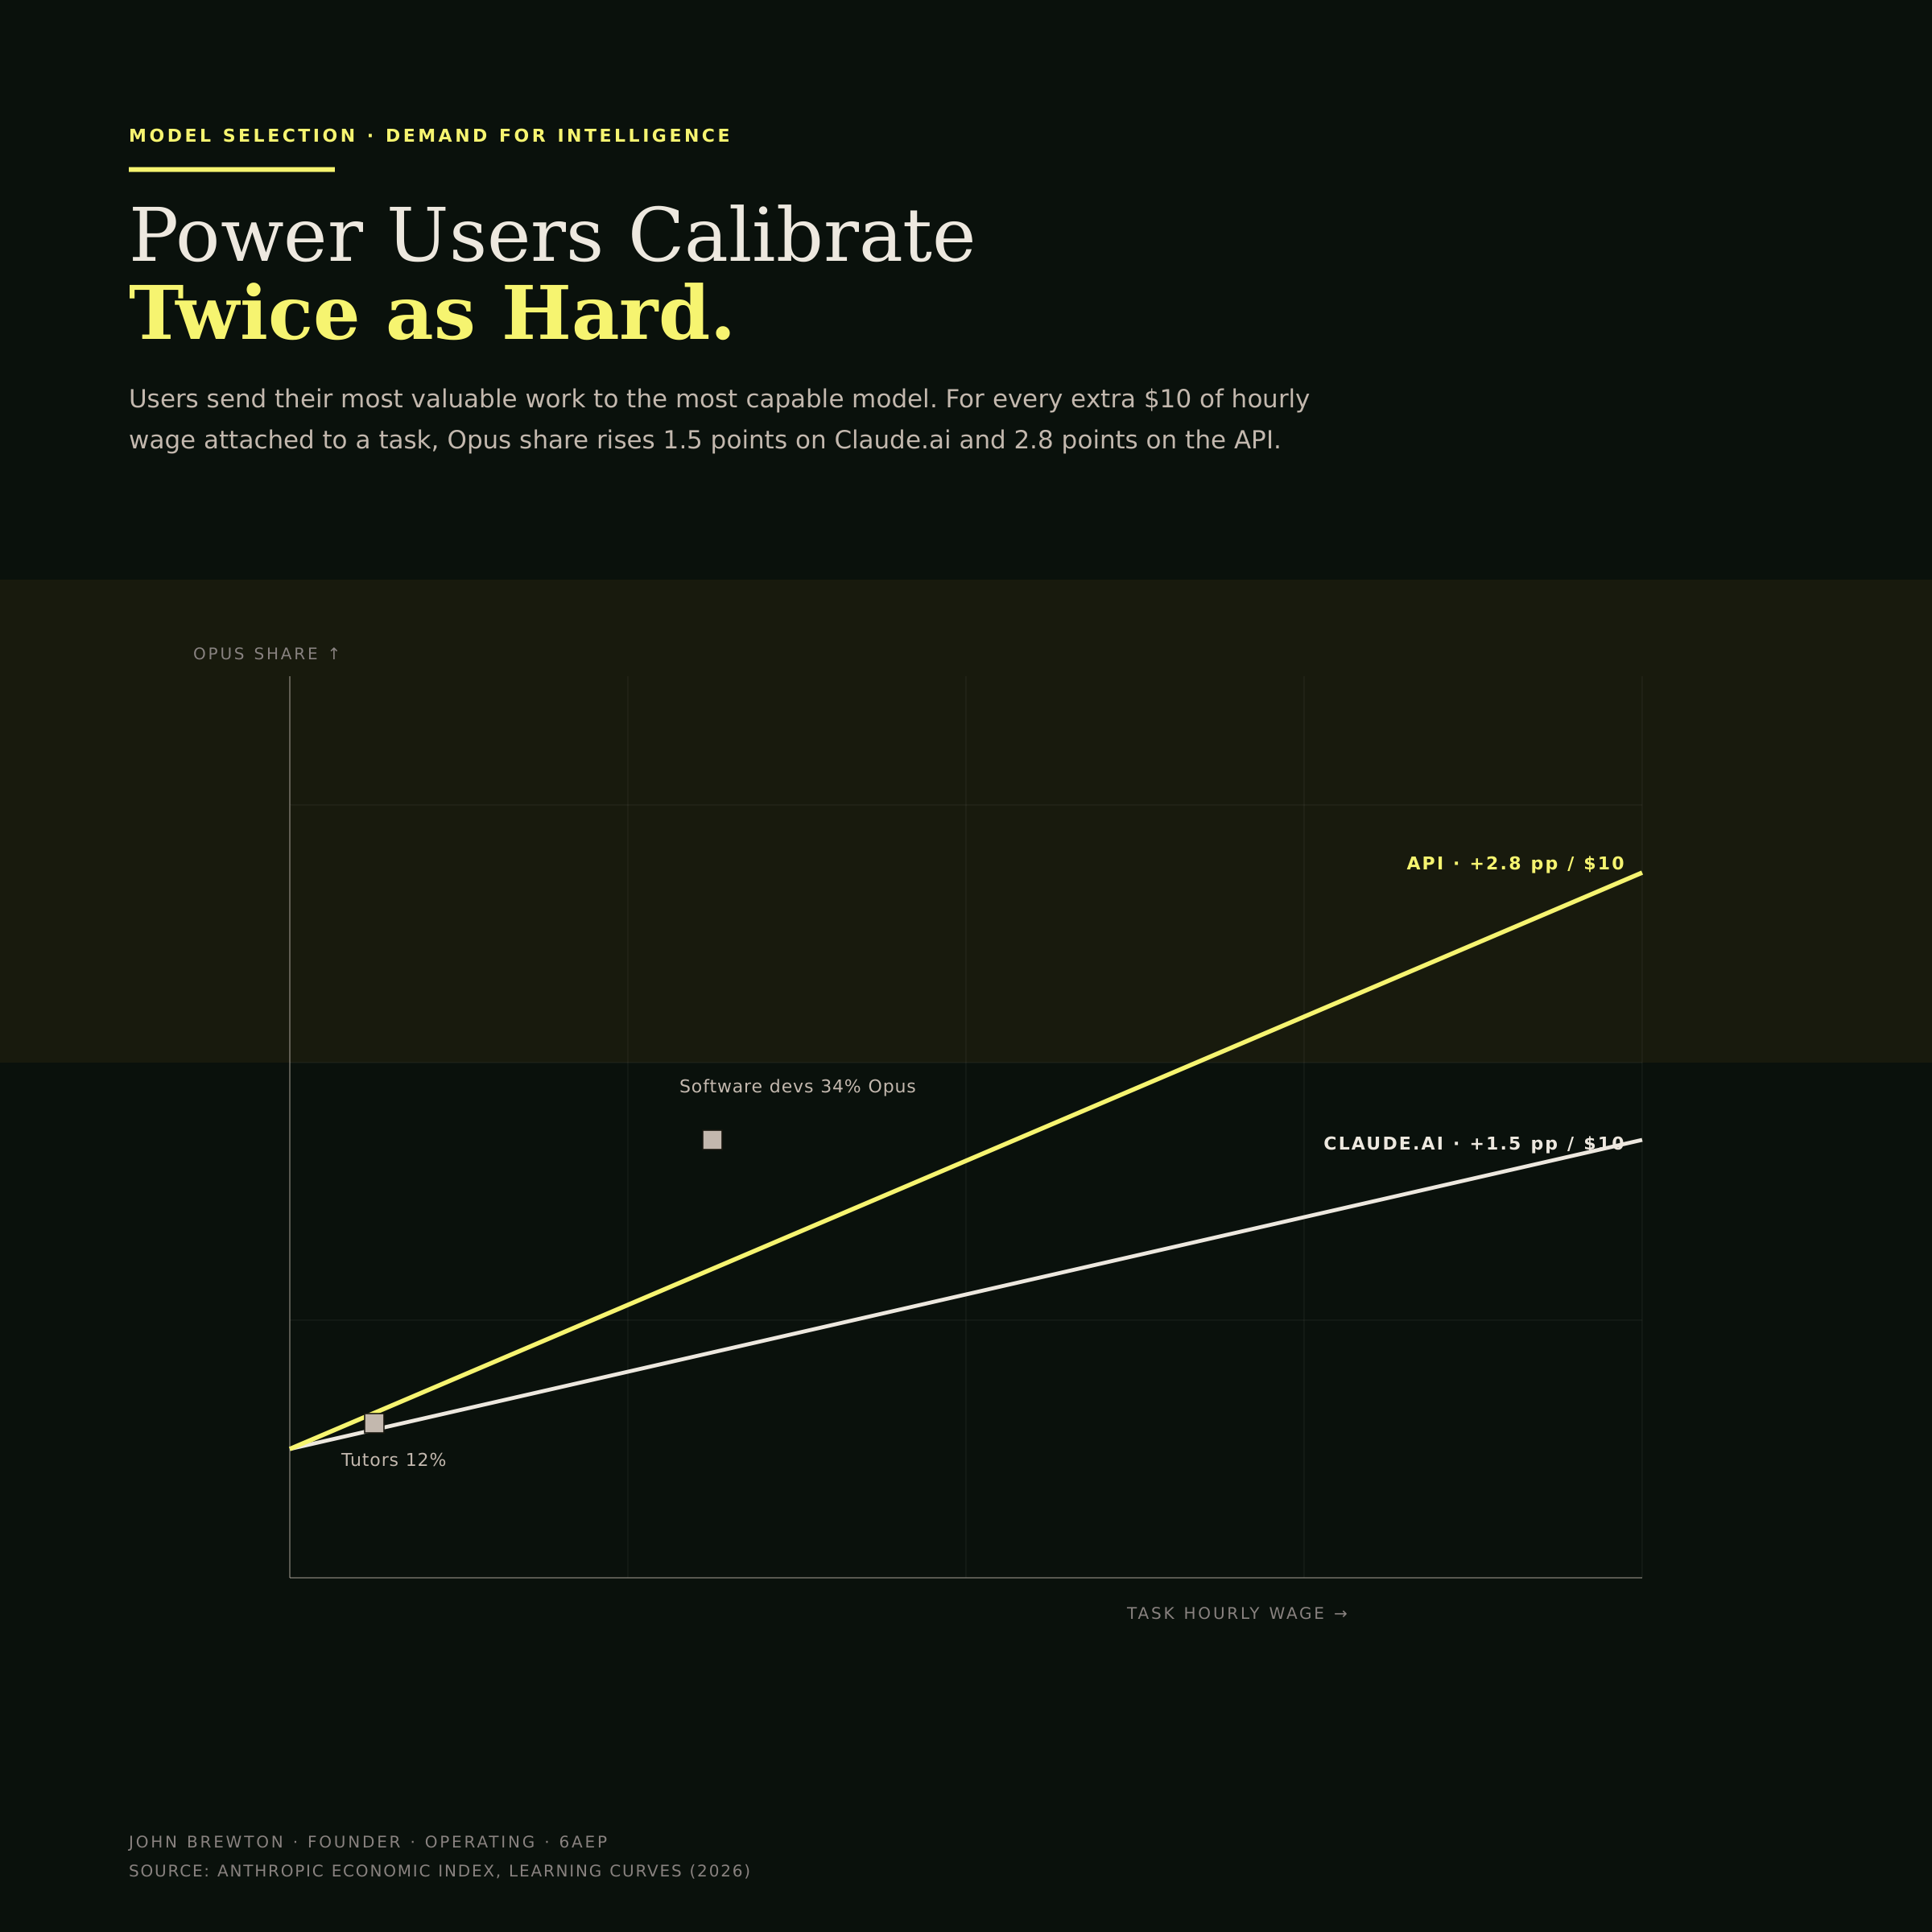
Two slopes, one behavior. As the value of a task rises, sophisticated users reach for the more capable model, and developers working through the API do it about twice as steeply as web users. The slope is a portrait of judgment: knowing which model to spend on is itself a learned skill.
Adoption is uneven and staying that way. The top 20 countries account for 48% of per-capita usage, up from 45%, while usage within the United States slowly converges. Read the two datasets together, and the conclusion is plain. Ready organizations deploy in weeks. Experienced users succeed more often. The gap between early movers and everyone else widens with time. The cost of waiting is not flat (Figure 11).
Figure 11 · Adoption concentration ·
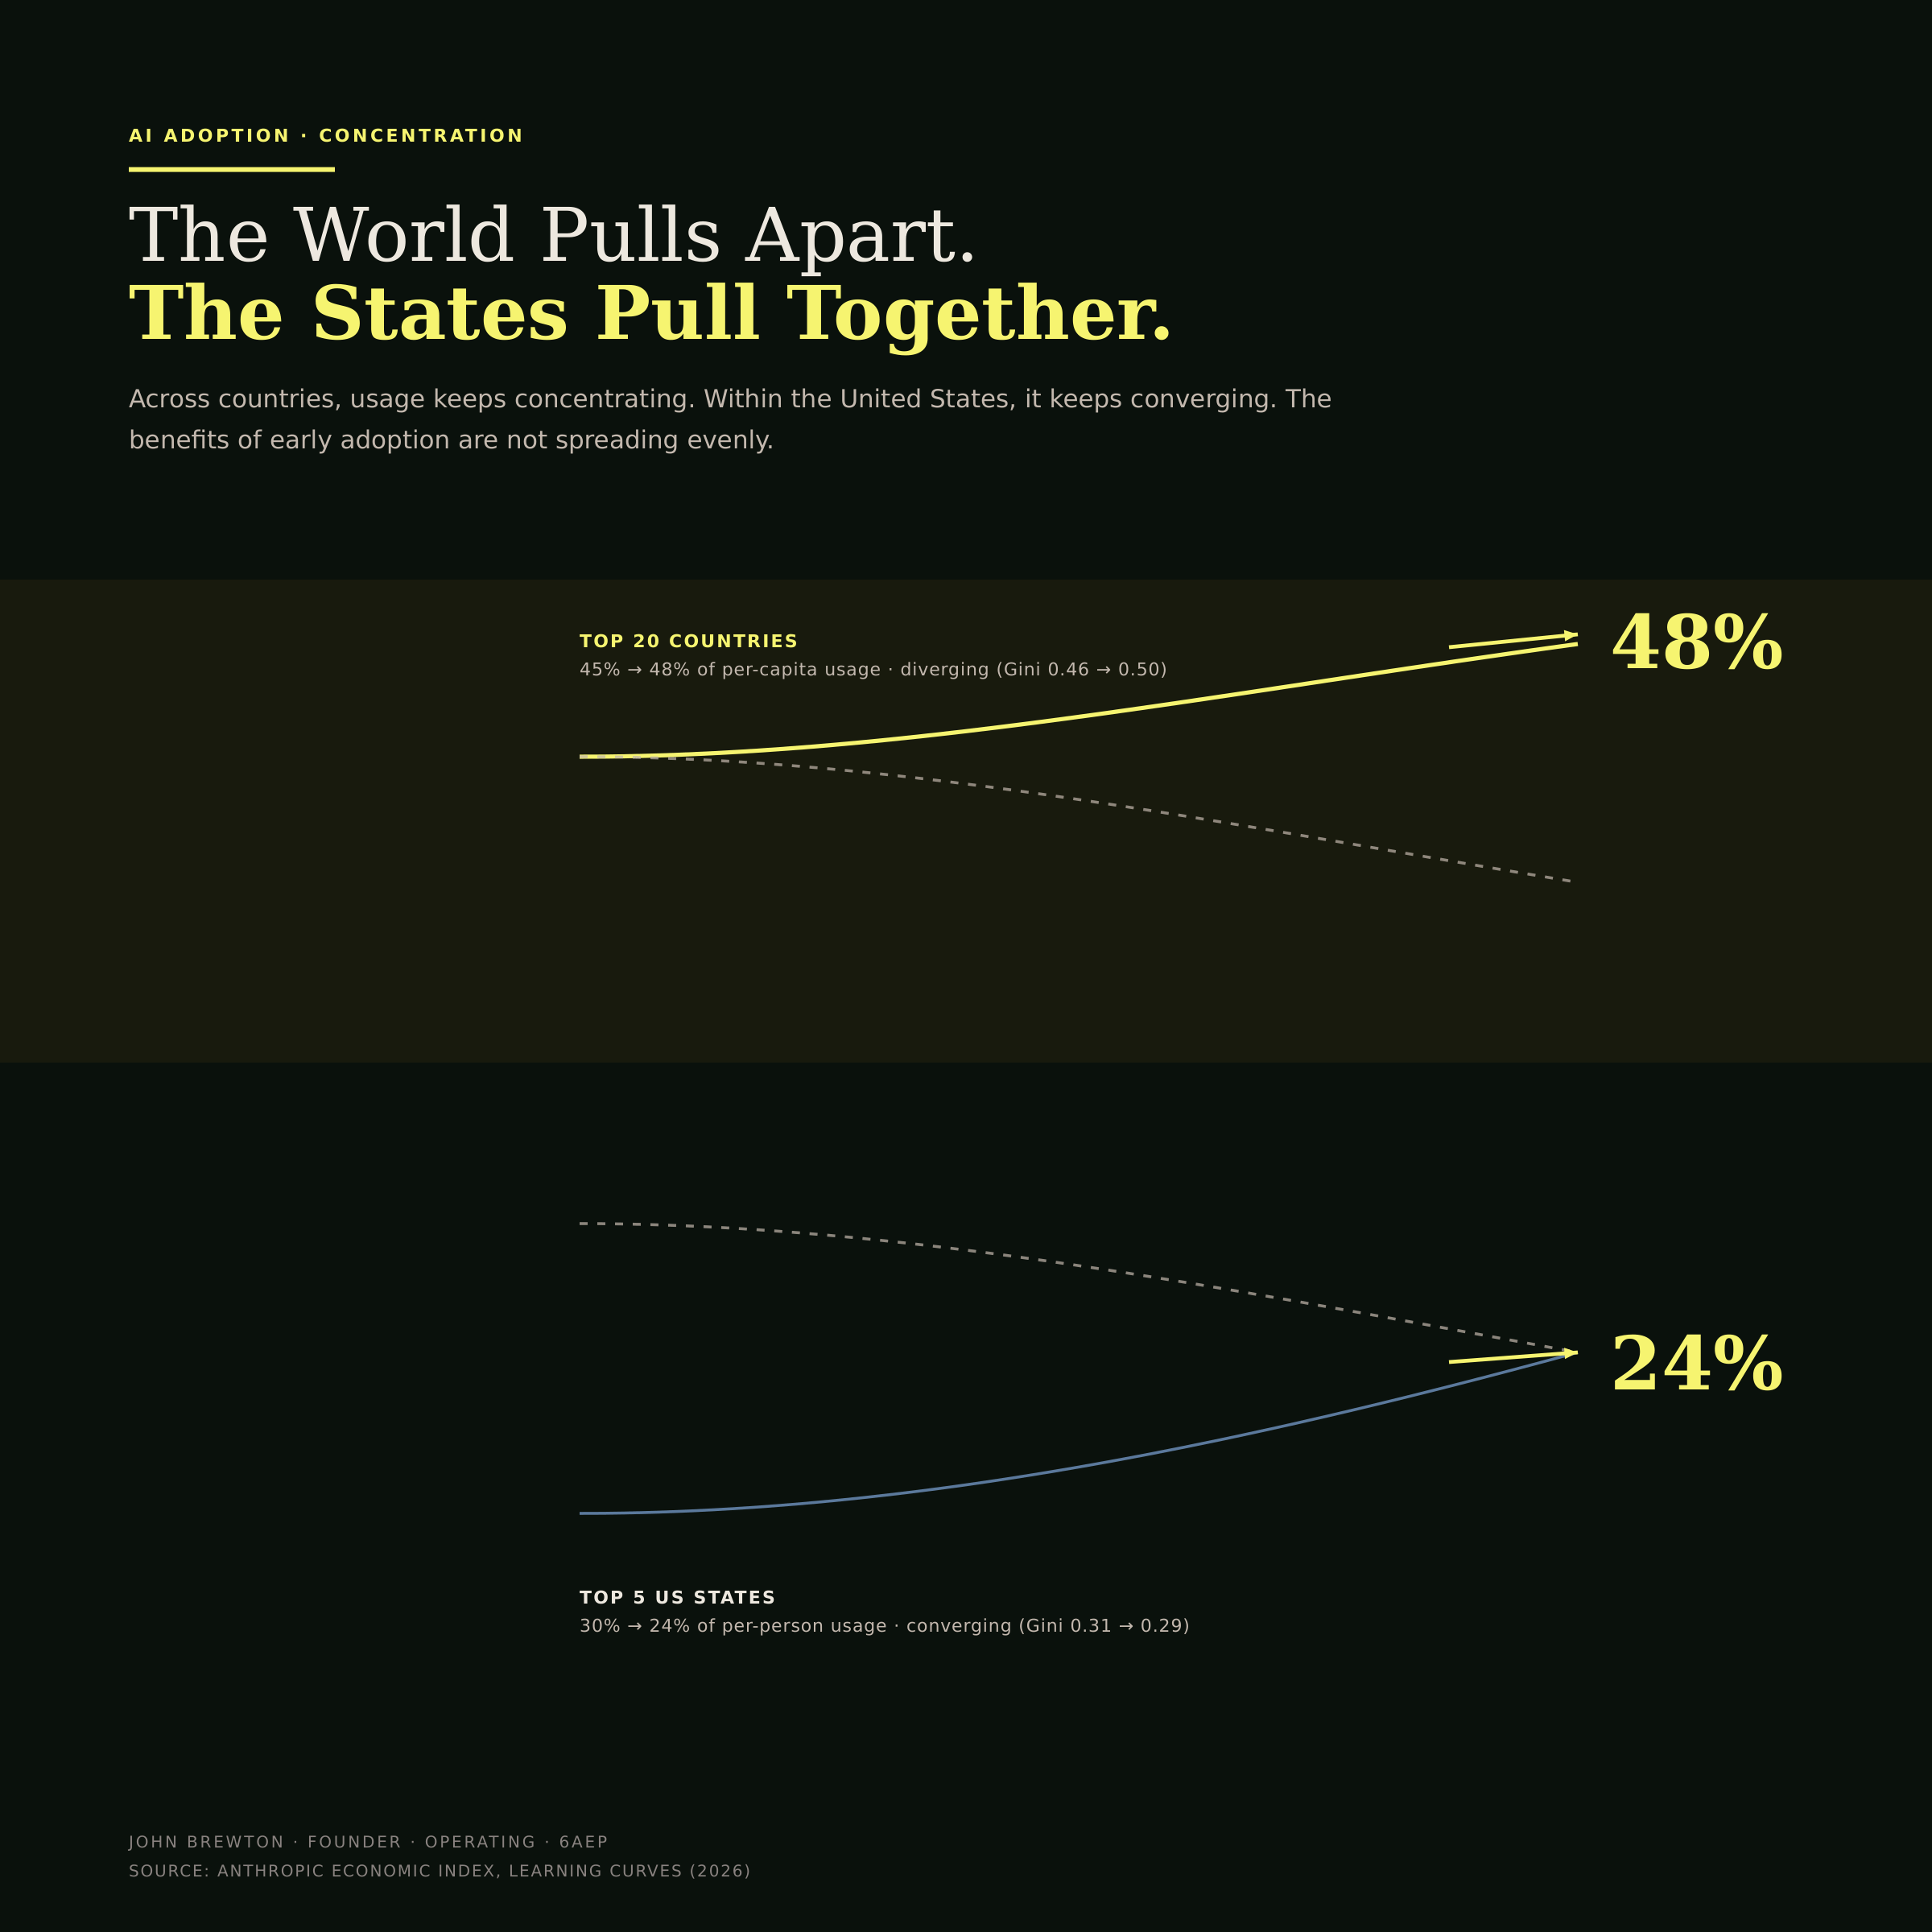
Two arrows moving in opposite directions. Across countries the heaviest users pull further ahead, while inside the United States usage slowly evens out. The composition holds both truths at once and underlines the theme: the benefits of early adoption are concentrating, not spreading evenly.
Does enterprise AI reduce headcount, and where should AI budget go?
Step back and the throughline resolves. For 42% of implementations, model choice was fully interchangeable. The durable advantage sat in the orchestration layer and the organization around it, not in the foundation model. As open-source models close the performance gap, the differentiator shifts from which model you run to what data you feed it and how well your organization works. Model choice only starts to matter as task complexity rises (Figure 12).
Figure 12 · The commodity boundary
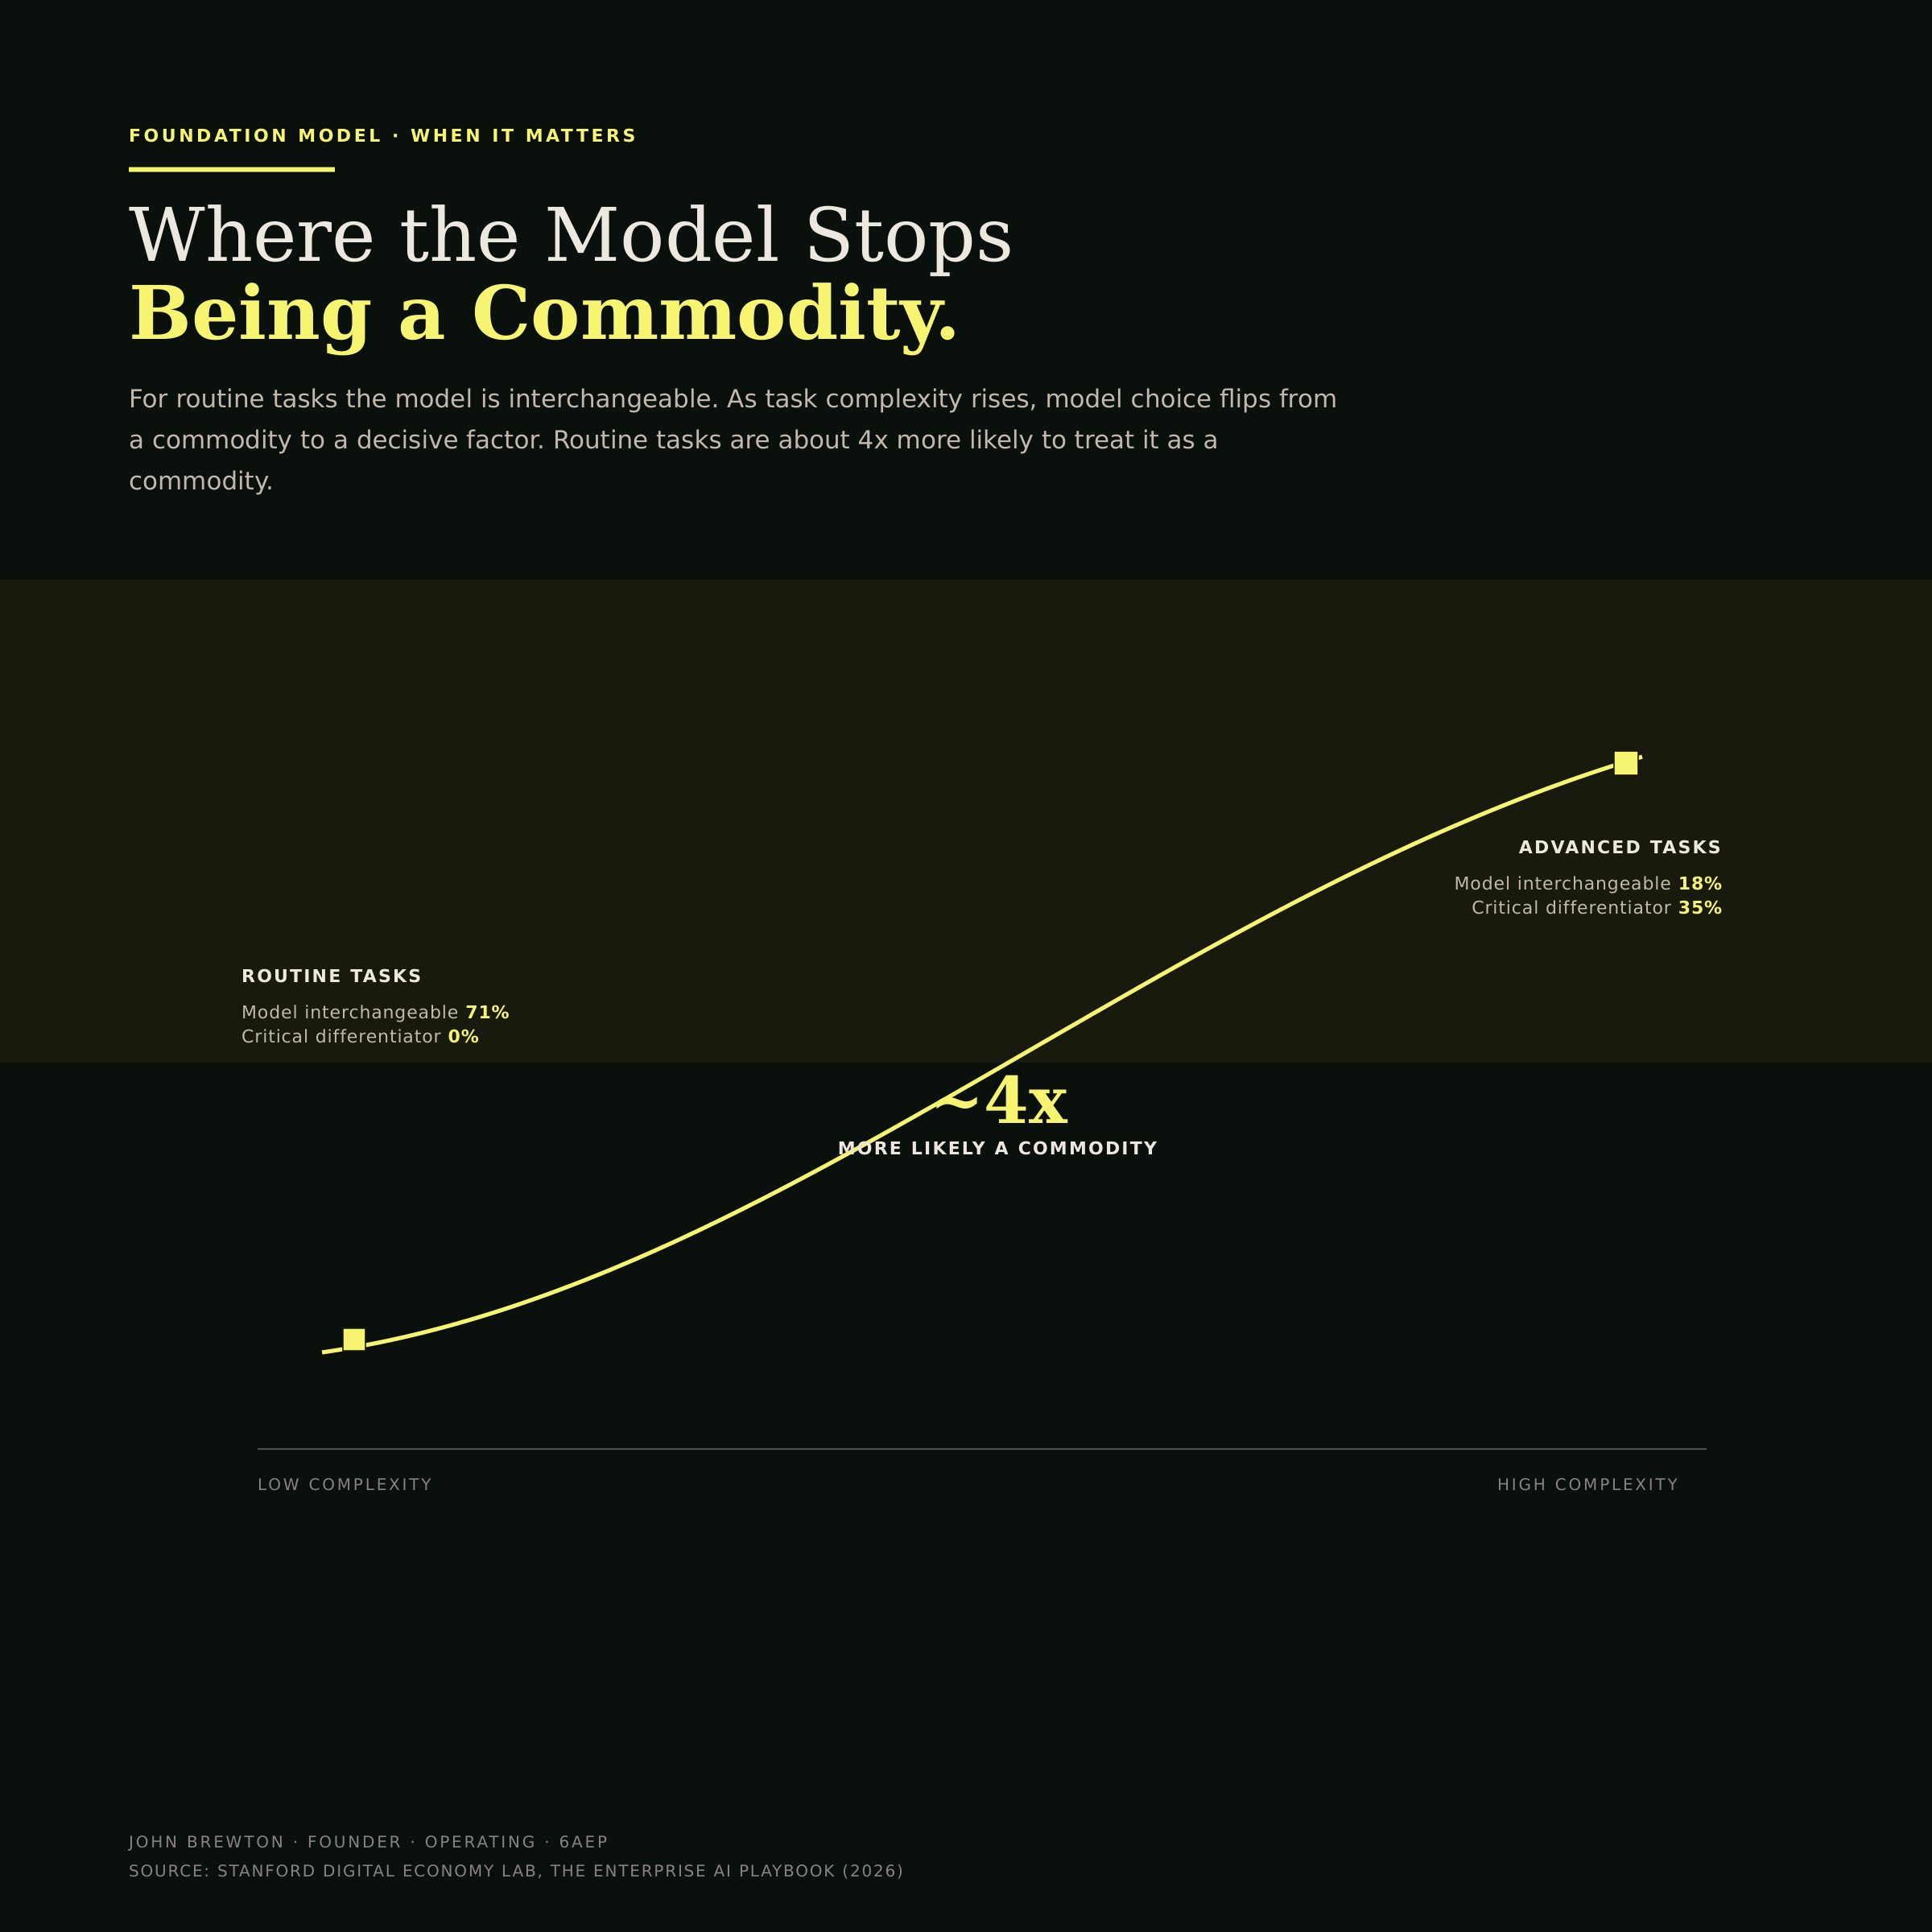
The boundary line rises with complexity. For routine work the model is interchangeable, so the smart money is spent elsewhere. For advanced, consequential work the model becomes a real differentiator. The chart tells an operator exactly where model choice stops being a commodity and starts being a decision.
That reframes the question most leaders are actually asking: what AI does to headcount. Reduction was the largest single outcome at 45%. It was also a minority. The other 55% of deployments redeployed people to higher-value work, avoided planned hiring, or reinvested the gains into the roadmap. Reduction is a choice an organization makes, not a verdict the technology delivers. The forward-looking caveat is real and worth stating plainly. ADP payroll data show that early-career workers aged 22 to 25 in AI-exposed occupations have already experienced a 16% relative decline in employment since late 2022. The 45% figure may be a floor (Figure 13).
Figure 13 · The headcount fork
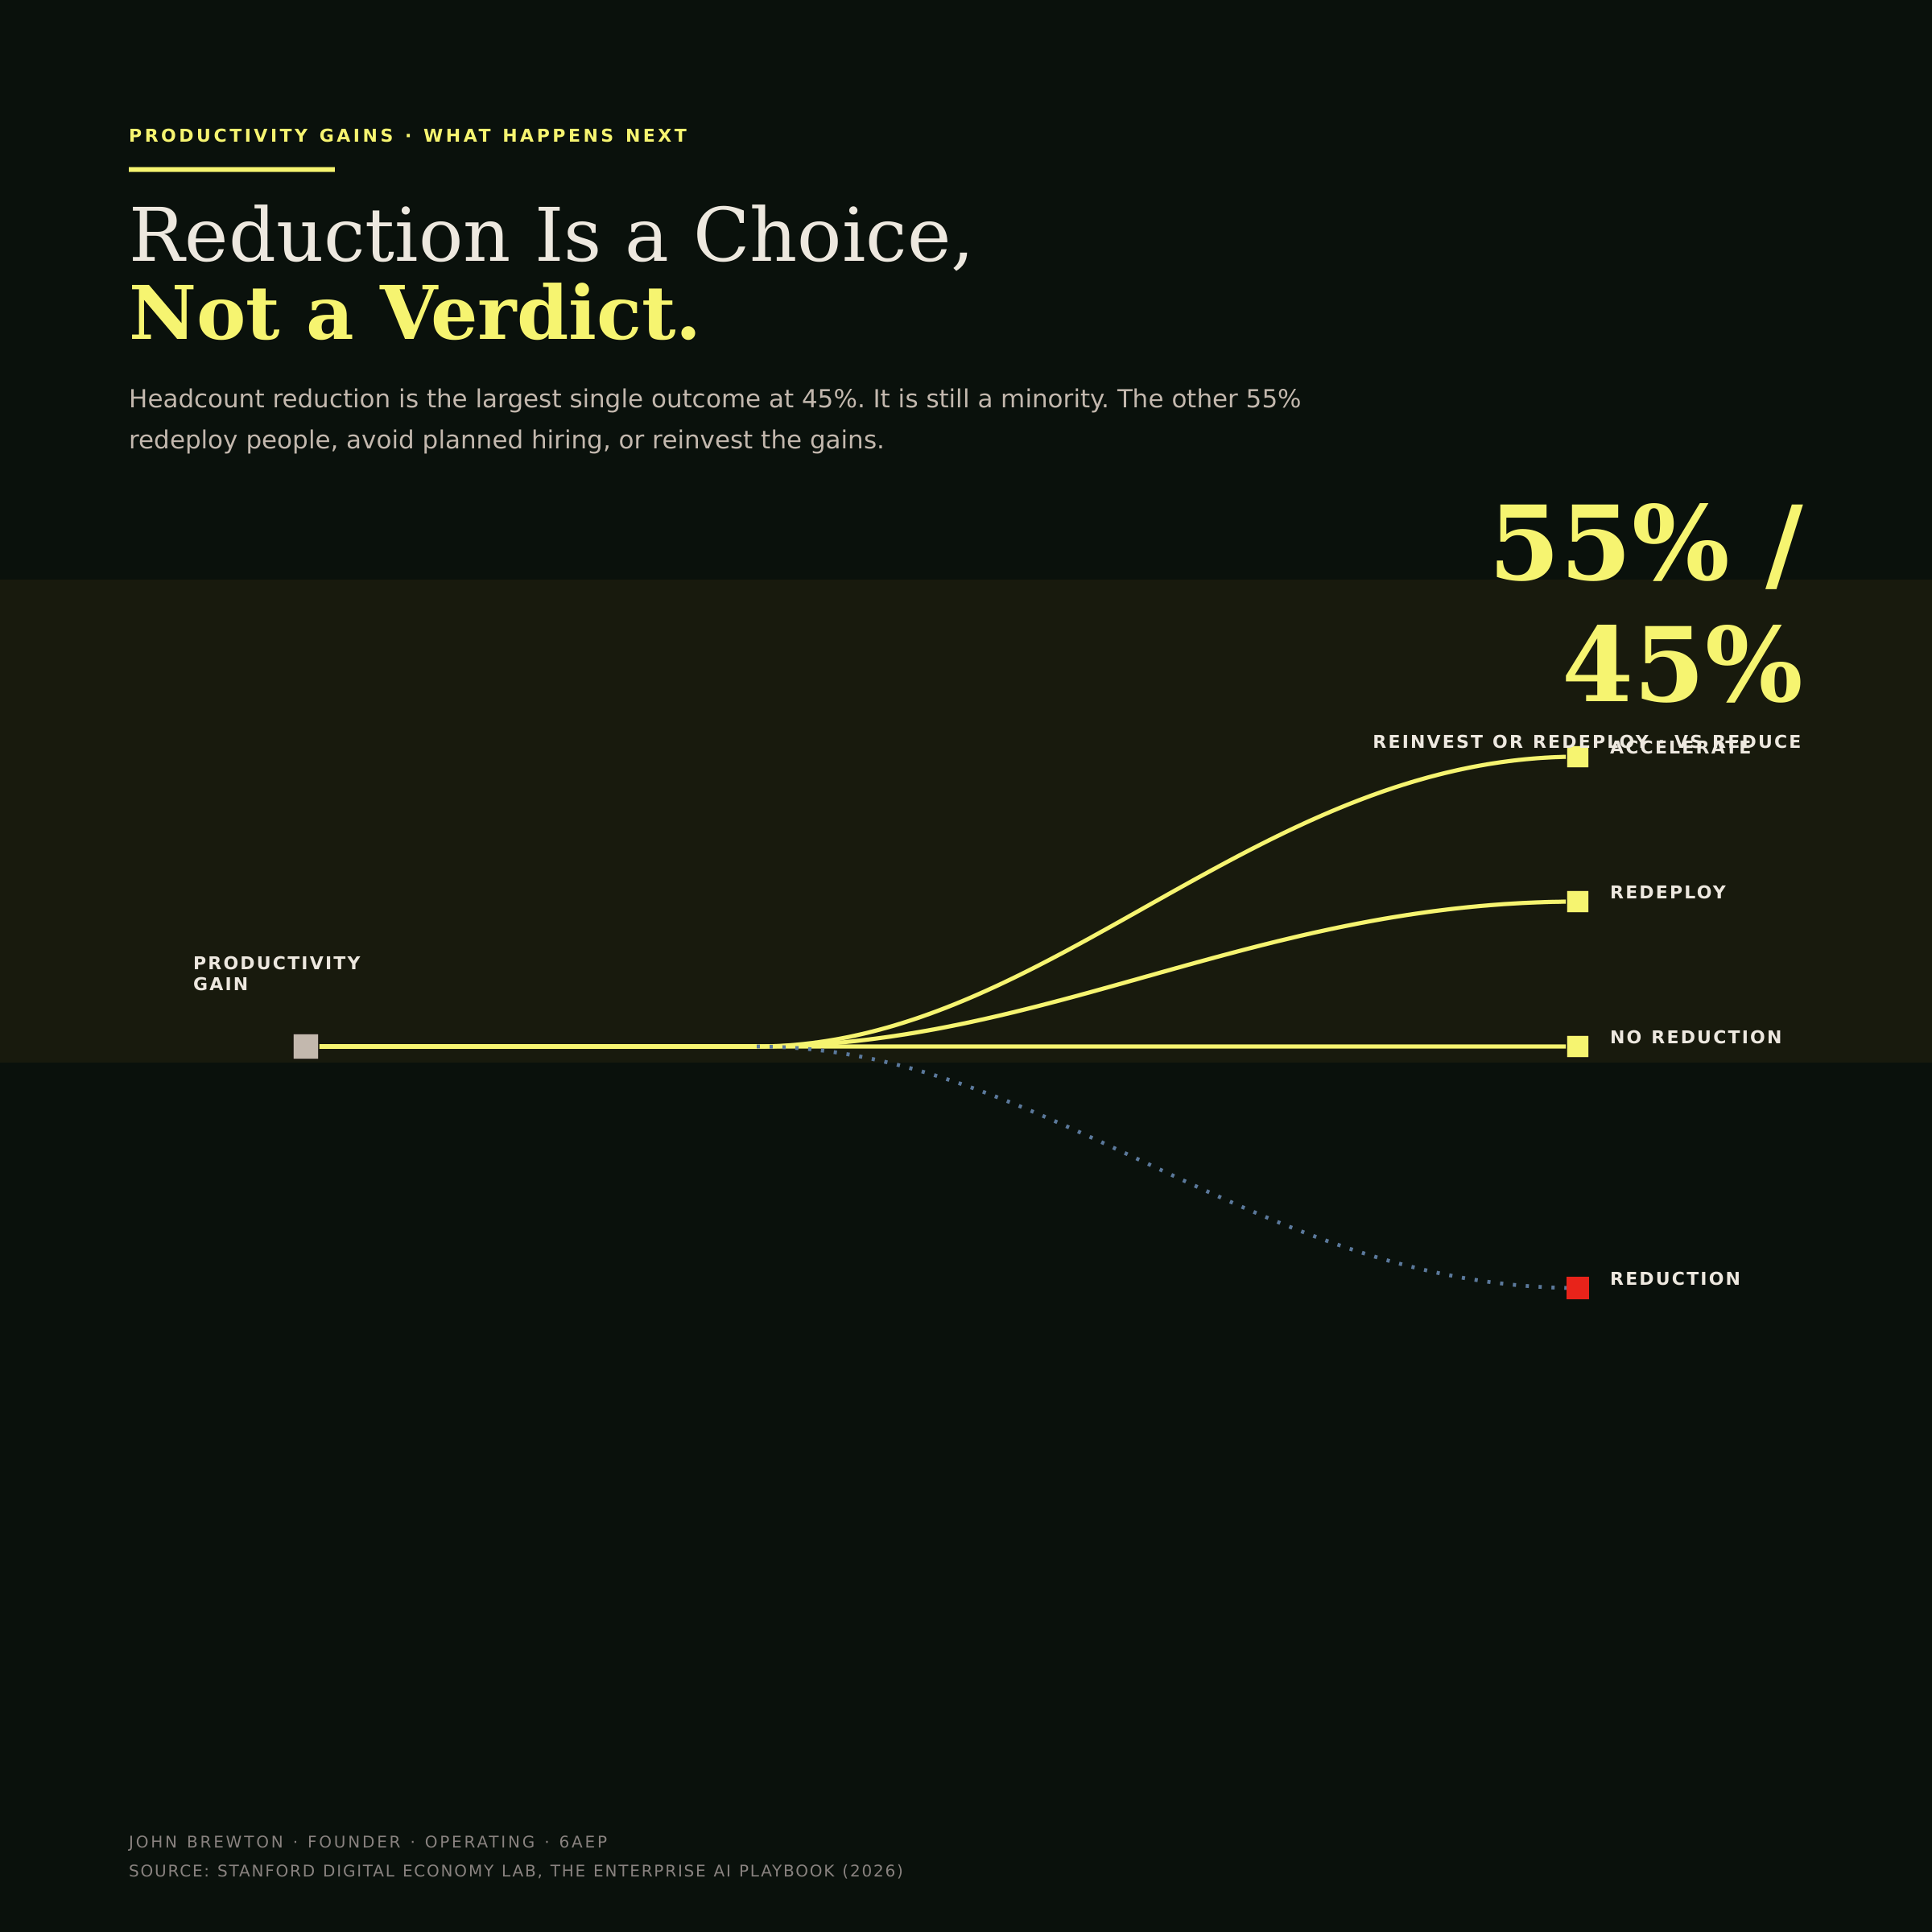
One gain, two destinations. The same productivity improvement forks into the 55% that reinvest or redeploy and the 45% that cut. Drawing it as a fork rather than a fait accompli is the point: the technology produces the gain, the organization chooses what to do with it.
One more pattern deserves attention because it is where the next advantage sits. Agentic AI appeared in only 20% of deployments but delivered a 71% median productivity gain, the highest of any approach. The least-used approach pays the most (Figure 14).
Figure 14 · The agentic quadrant
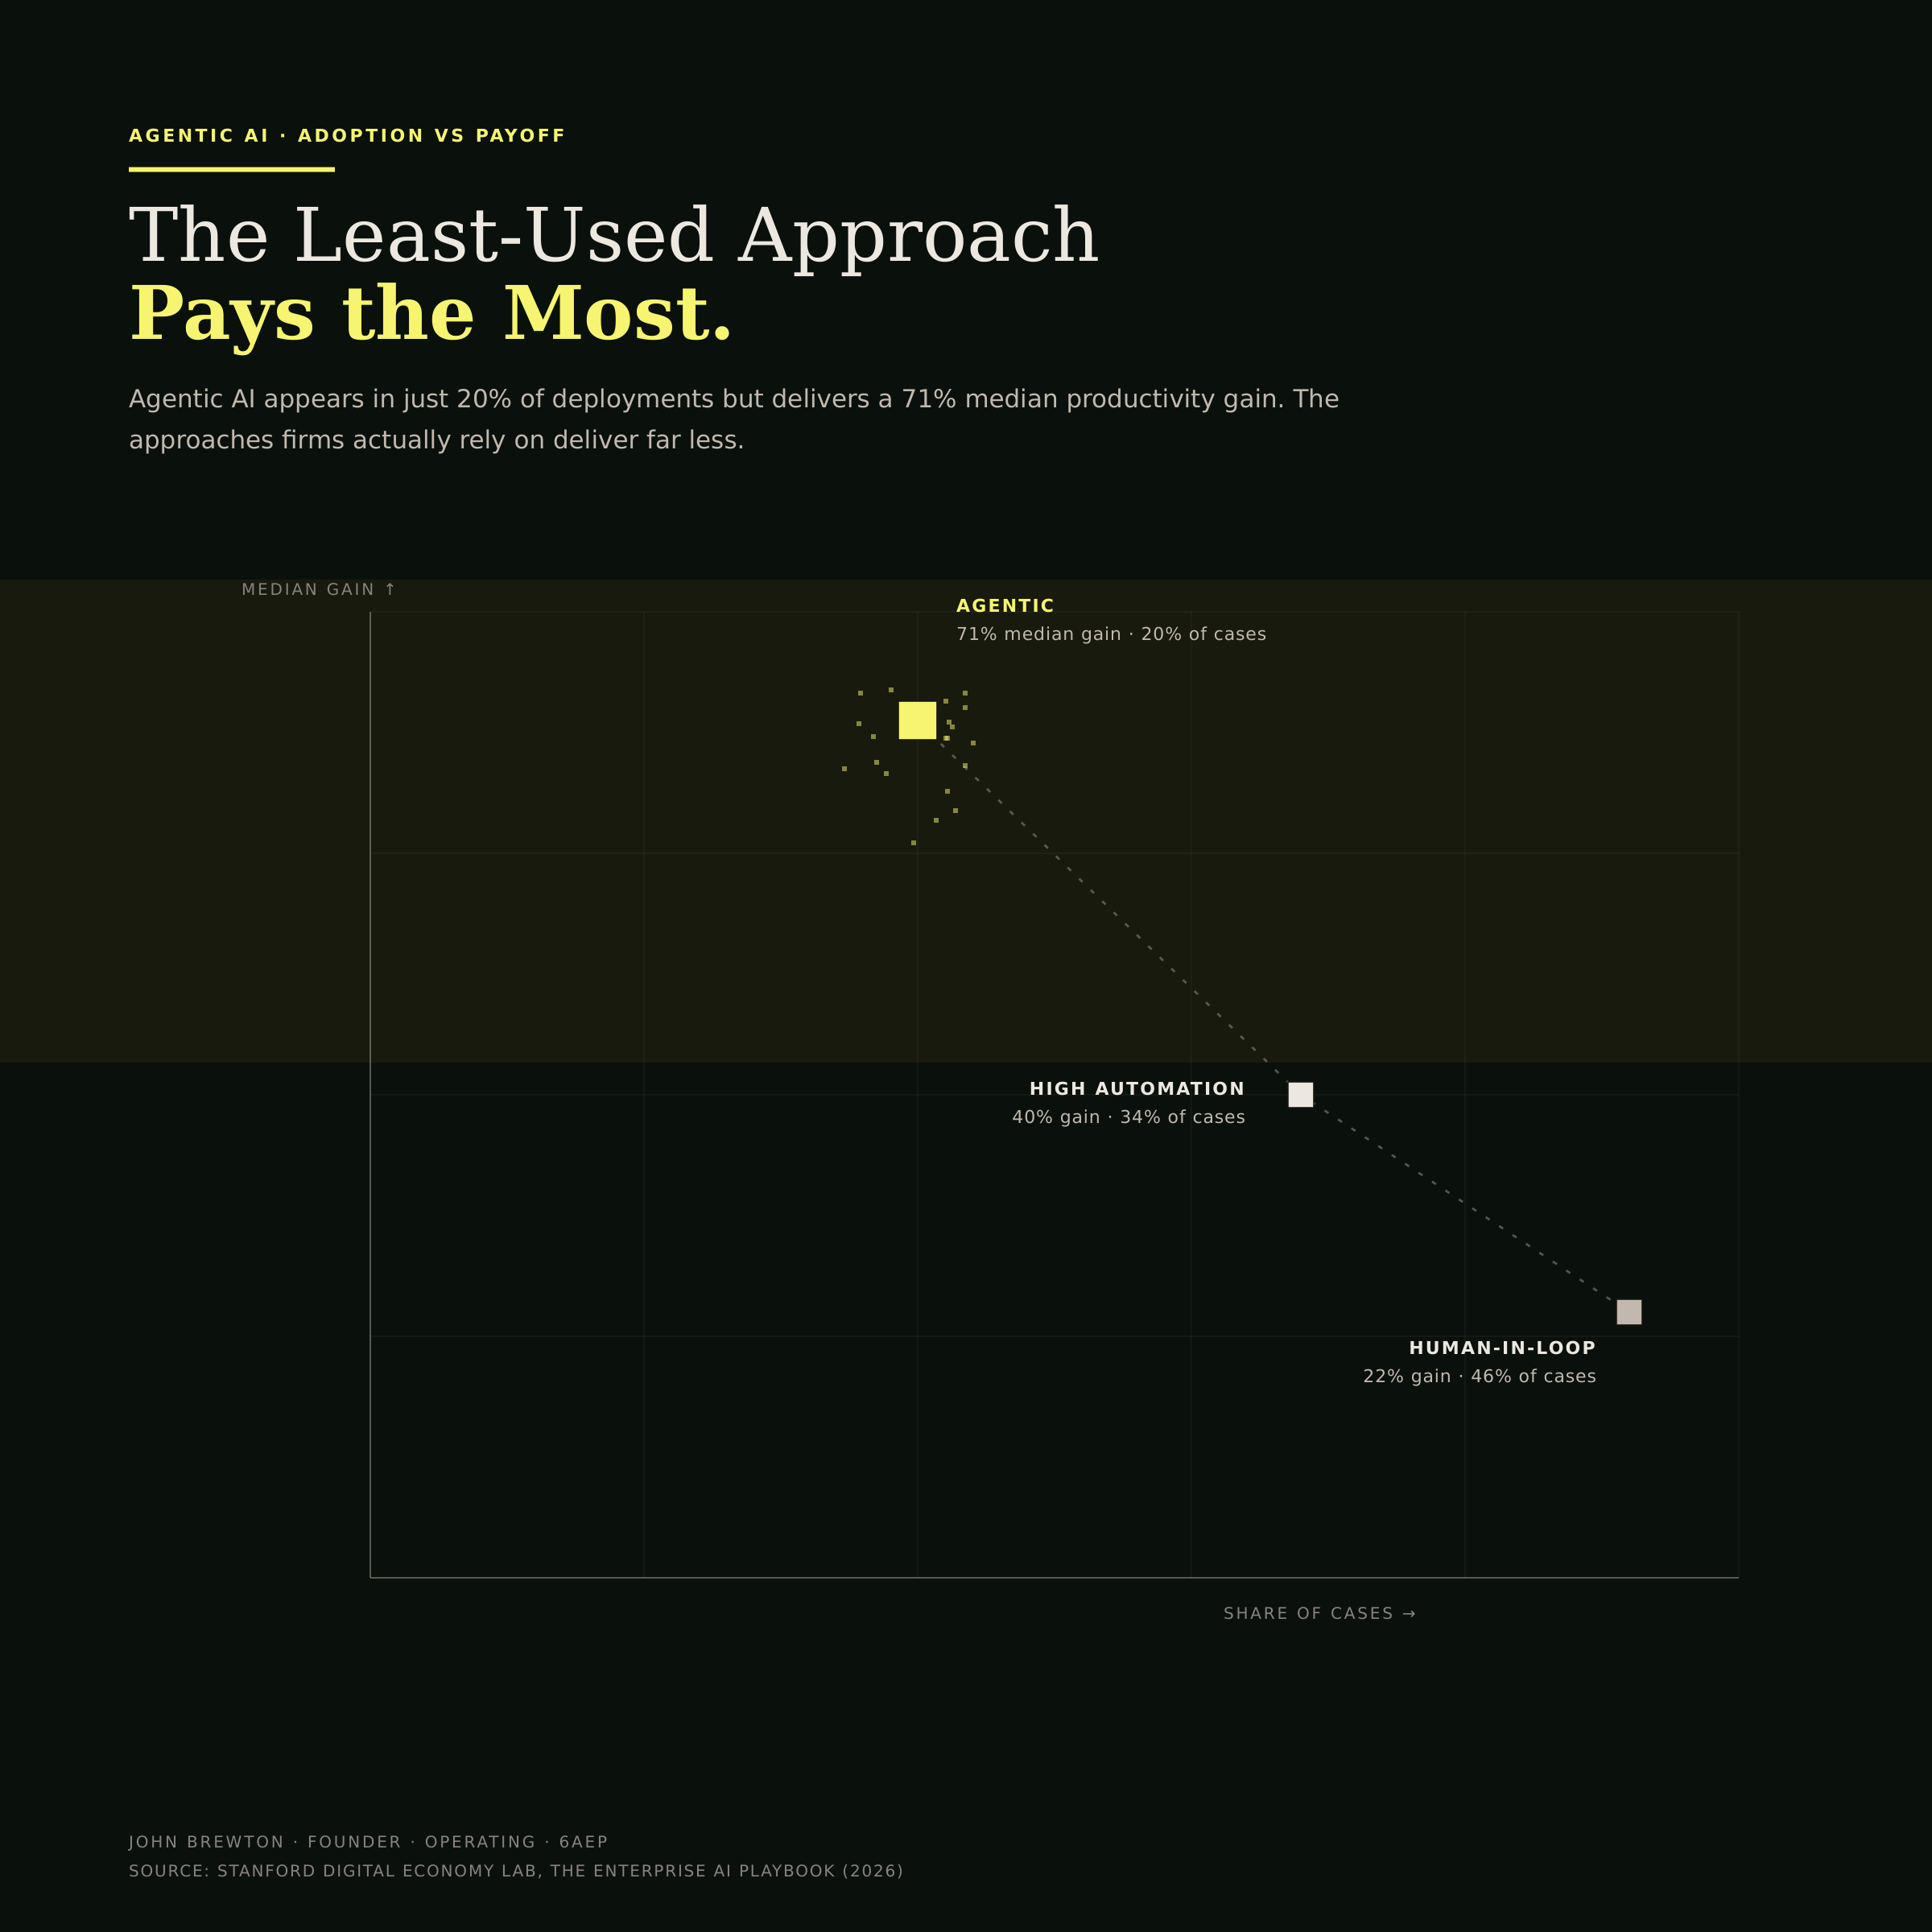
The quadrant inverts the usual intuition. Agentic AI is the least adopted approach and the highest paying, sitting alone in the top-left while the safer, more common approaches cluster lower and to the right. For a leader looking for the next edge, the empty space around the agentic node is the opportunity.
The companies that won pointed AI at revenue and new capability, not only at cost. They treated the model as the commodity it is becoming and devoted their utmost effort to the organization. The next dollar of AI budget should go to the same place, because that is where the bottleneck has been the whole time (Figure 15).
Figure 15 · The numbers that matter
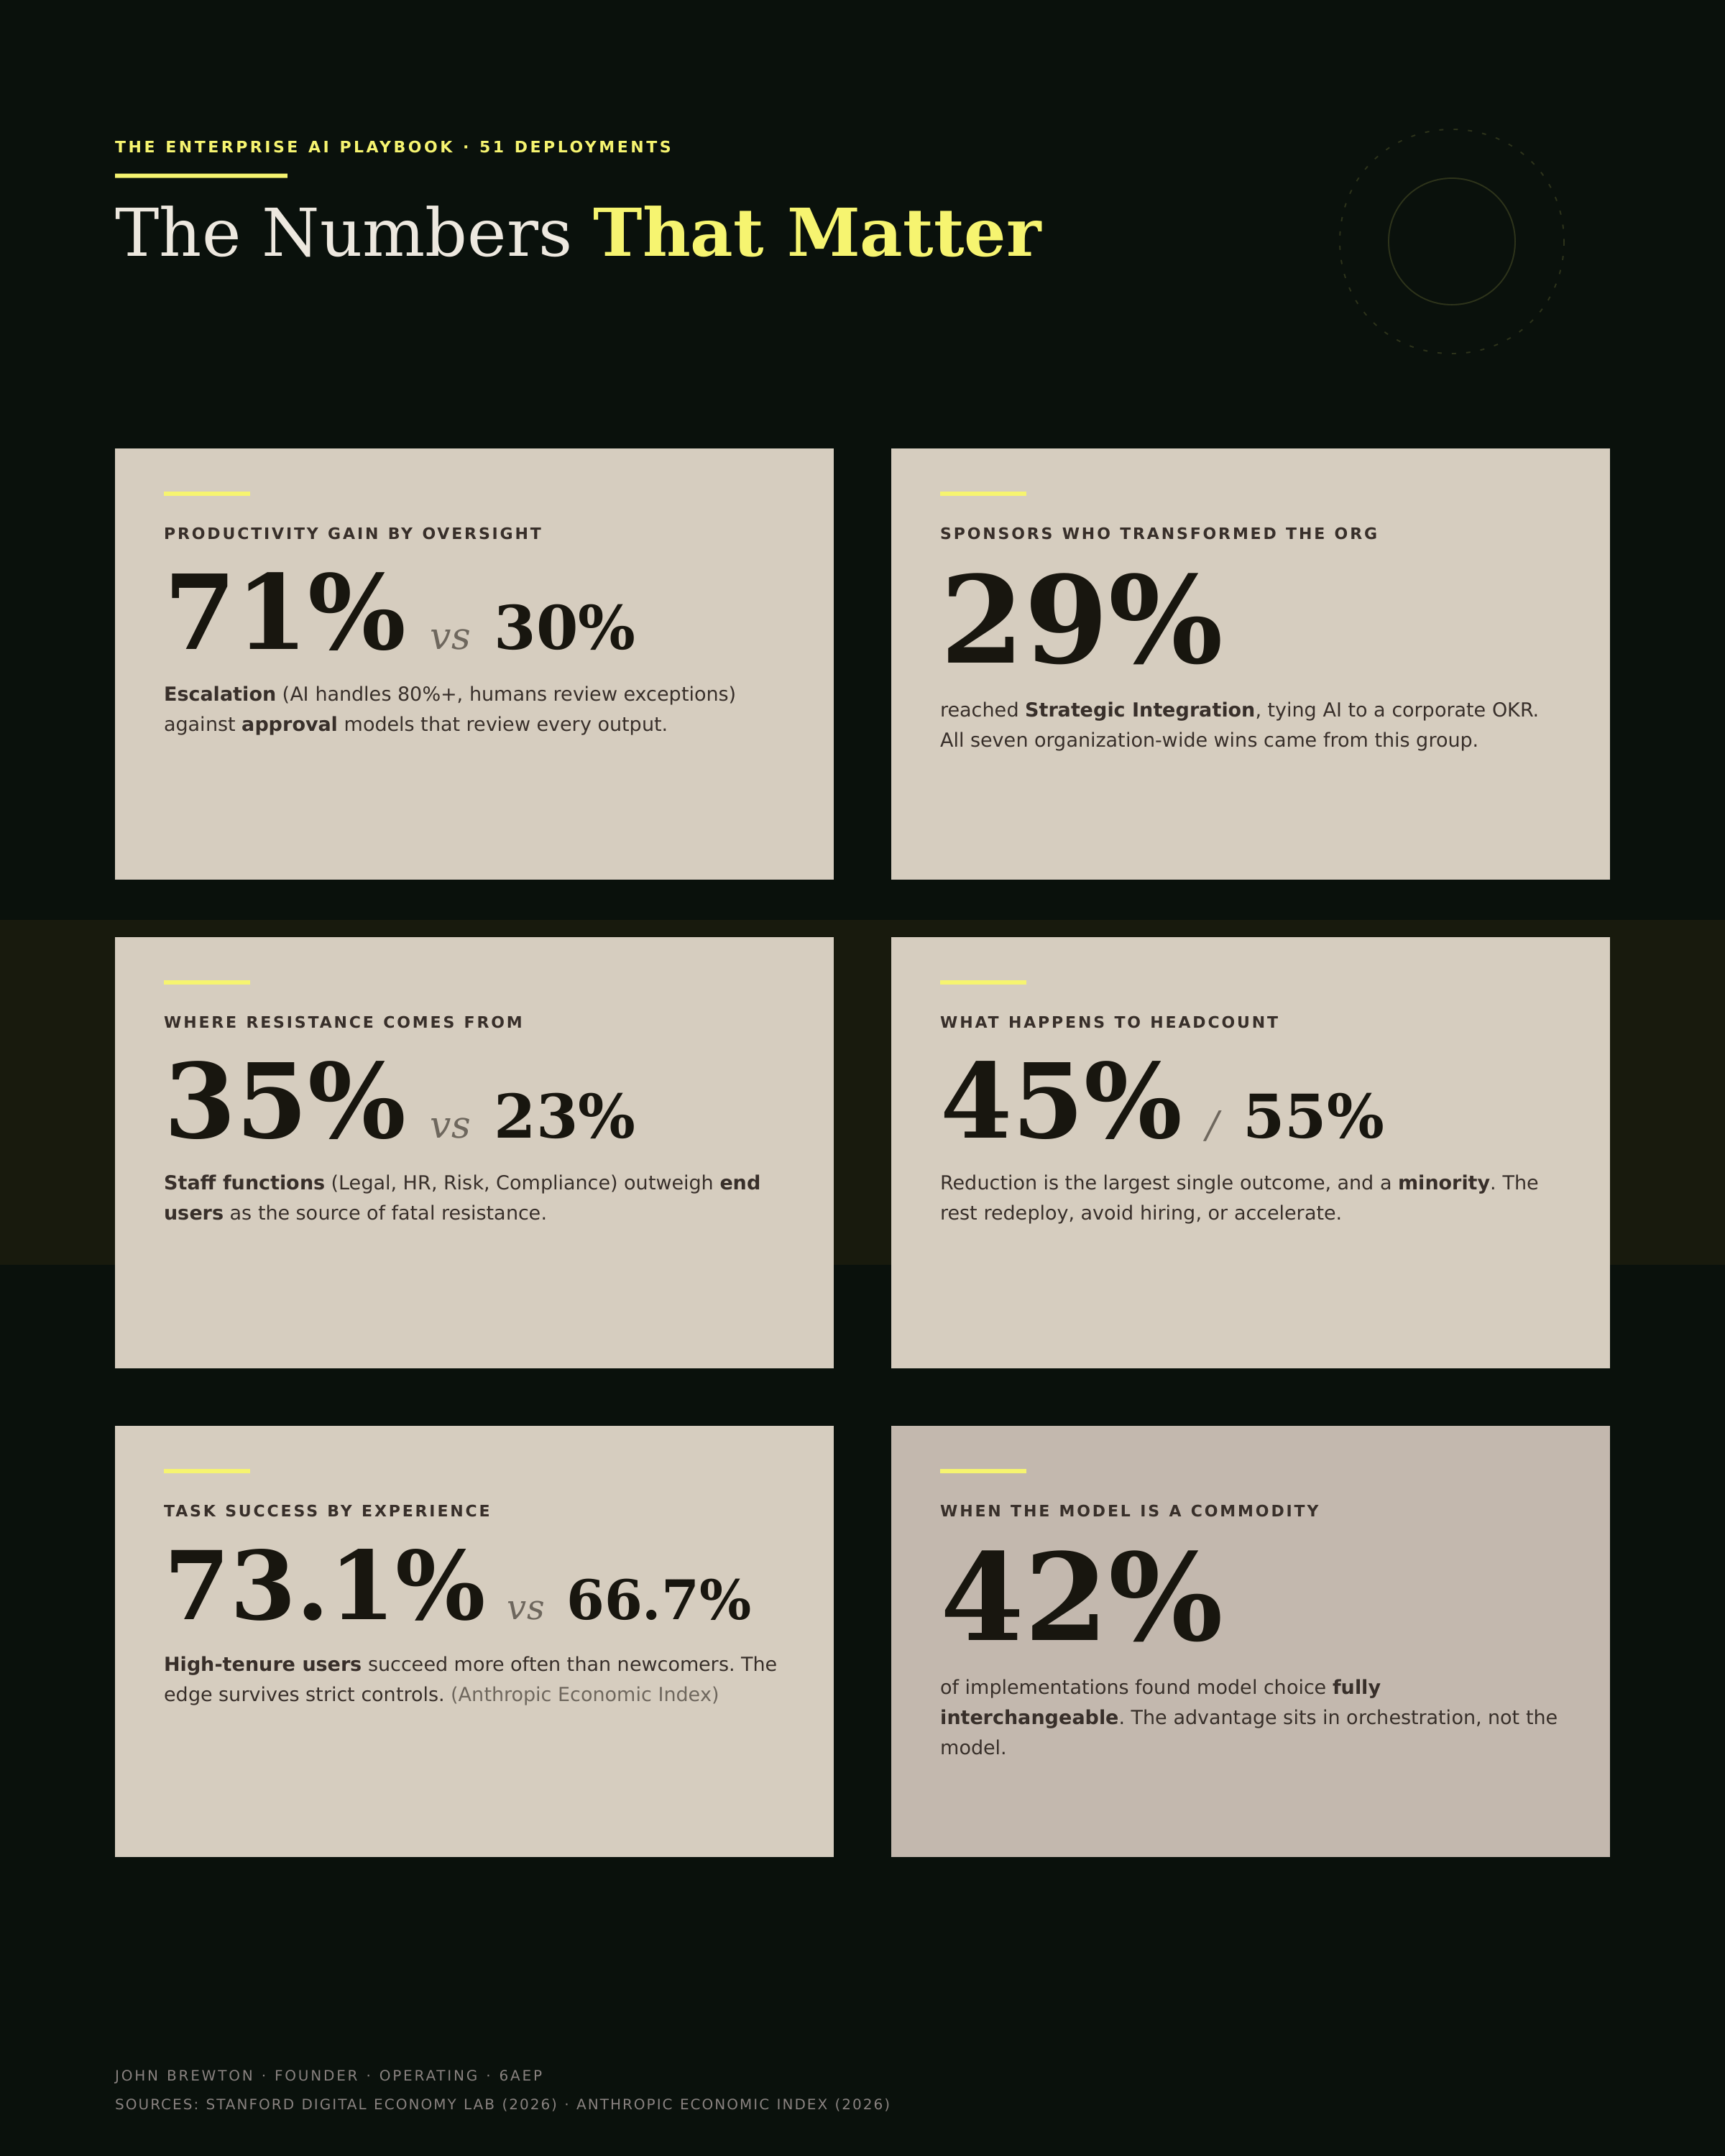
A single board to carry away. Six numbers, each one a section of the argument compressed to its figure. It works as the closing slide and as the social card: if a reader keeps only one image, this is the one that holds the whole case.
Are you new to Operating?
You might enjoy these recent reader favorites:
Frequently asked questions
Why do most enterprise AI pilots fail? They fail for organizational reasons, not technical ones. The MIT NANDA study reported a 95% failure rate and attributed it to workflow integration and misaligned incentives. Stanford’s 51 successes confirm the inverse: the model was never the differentiator.
Is the AI model the most important factor in enterprise AI success? No. For 42% of implementations, the model was fully interchangeable. The durable advantage sits in the orchestration layer, the proprietary data, and the surrounding organization. Model choice only becomes decisive as task complexity rises.
How long does enterprise AI take to deliver ROI? It ranges from weeks to years for the same use case. The variable is organizational: executive sponsorship, an existing foundation, and genuine user demand accelerate it. Learning curve, data prep, compliance, and documentation gaps slow it down.
Who resists enterprise AI adoption the most? Staff functions, not frontline workers. Legal, HR, Risk, and Compliance accounted for 35% of resistance, ahead of end-users at 23%. They respond to a governance role and a clear mandate, not persuasion.
Does enterprise AI cause layoffs? Sometimes. Reduction was the largest single outcome at 45%, but most deployments redeployed people, avoided hiring, or reinvested the gains. Reduction is a choice, not an inevitability, though early-career roles are already declining 16% in AI-exposed occupations.
Does agentic AI deliver better results? Yes, where it fits. Agentic implementations delivered a 71% median productivity gain, the highest of any approach, but appeared in only 20% of cases. It suits high-volume, repetitive work with clear success criteria and recoverable errors.
How clean does enterprise data need to be for AI? Cleaner is better, but perfection is not the gate. Only 6% of deployments had fully ready data, yet 91% processed unstructured data and 88% made inaccessible data usable. Access matters more than centralization, and proprietary data is the durable moat.
Does skill with AI compound over time? Yes. High-tenure users succeed 73.1% of the time, compared with 66.7% for newcomers, and the edge survives strict controls. The advantage accrues to those who start early and build the habit.
Appendix
Primary sources
Pereira, E., Graylin, A. W., and Brynjolfsson, E. (2026). The Enterprise AI Playbook: Lessons from 51 Successful Deployments. Stanford Digital Economy Lab. Publication page · Full PDF
Massenkoff, M., Lyubich, E., McCrory, P., Appel, R., and Heller, R. (2026). The Anthropic Economic Index Report: Learning Curves. Anthropic. Report
MIT Project NANDA (2025). The GenAI Divide: State of AI in Business 2025. Reported figure: 95% of generative AI pilots produce no measurable financial impact. Coverage via Fortune & MIT Media Lab
Supporting references
Brynjolfsson, E., Rock, D., and Syverson, C. (2021). The Productivity J-Curve. National Bureau of Economic Research. The framework behind the report’s macro context.
ADP payroll data, cited in the Stanford report: early-career workers aged 22 to 25 in AI-exposed occupations saw a 16% relative employment decline since late 2022.
Books by the authors
Erik Brynjolfsson and Andrew McAfee. The Second Machine Age: Work, Progress, and Prosperity in a Time of Brilliant Technologies. W. W. Norton, 2014. Buy on Amazon
Andrew McAfee and Erik Brynjolfsson. Machine, Platform, Crowd: Harnessing Our Digital Future. W. W. Norton, 2017. Buy on Amazon
Alvin Wang Graylin and Louis Rosenberg. Our Next Reality: How the AI-powered Metaverse Will Reshape the World. Foreword by Neal Stephenson. Nicholas Brealey, 2024. Buy on Amazon
Download the companion research reports
Inside 51 Successful AI Deployments. The Stanford playbook distilled: 11 headline findings, all 34 detailed findings by chapter, and a 10-point operator checklist. (Report-1_Inside-51-Successful-AI-Deployments.pdf)
The Learning Curve. The Anthropic Economic Index data on adoption, model selection, and why experience compounds. (Report-2_The-Learning-Curve.pdf)
John Brewton · Founder · Operating · 6AEP

About the author
John Brewton documents the history and future of operating companies at Operating by John Brewton. He is a graduate of Harvard University and began his career as a PhD student in economics at the University of Chicago. After selling his family’s B2B industrial distribution company in 2021, he has been helping business owners, founders, and investors optimize their operations ever since. He is the founder of 6A East Partners, a research and advisory firm asking the question: What is the future of companies
Important to have your data well-structured and ready. We invested in https://melow.ai/ to solve that issue
Pretty insightful read, John!
I also liked the lead image a lot, it caught my eye.